Main Home How it works The science Pricing FAQ Contact Us Blog Services ADHD Brain Screening Comprehensive Assessment Family Package Medication Scan Who it’s for Children (6+) Adults Women & girls Teenagers ADHD Support Support hub Results explained What to do next GP appointment guide Coping strategies Medication guide Workplace rights Women & girls Parent's guide Guides NHS waiting list Evidence for your GP EHCP evidence Access to Work Right to Choose Psychiatric assessment ADHD diagnosis guide Book a scan
Home Medication Scan
Add-on service

Medication Comparison Scan

Already on ADHD medication? This quick rescan objectively measures how your treatment is affecting brain activity. Compare your theta/beta ratio and attention metrics before and after medication — evidence that your treatment is working, or data to support a dosage review. Read our full medication guide or learn more about follow-up scanning.

£345 per scan
🕒 20 minutes session
📄 Same-day PDF report
🧠 4-electrode qEEG
Pay & book now → ← View all packages

Everything in this package

Quick 7-minute qEEG rescan

The same rigorous protocol as your initial screening — eyes-open, eyes-closed, and Go/No-Go task — ensuring a direct, comparable measurement.

Pre/post TBR comparison

We compare your current theta/beta ratio against your baseline scan, showing exactly how medication has shifted your brain's theta and beta activity.

Attention task comparison

Side-by-side comparison of your Go/No-Go performance: has your reaction time improved? Have omission errors decreased? Is impulsivity reduced?

Objective medication evidence

Many patients and parents want proof that medication is doing something. This scan provides quantifiable neurological evidence — not just subjective feelings.

Comparison PDF report

A clear report showing before and after metrics, percentage changes, and a visual comparison. Perfect for medication reviews with your psychiatrist.

Support dosage decisions

If your psychiatrist is considering adjusting your dose, objective brain data provides an additional data point to inform that decision. See our guide to psychiatric assessment.

  • Full 7-minute qEEG rescan protocol
  • Theta/beta ratio comparison vs baseline
  • Go/No-Go attention task comparison
  • Frequency band change analysis
  • Pre/post comparison PDF report
  • Percentage change calculations
  • Initial baseline scan (must have previous scan on file)
  • Clinical consultation (available as add-on)

Is this the right package for you?

This scan is for anyone already diagnosed with ADHD who has started medication (methylphenidate, lisdexamfetamine, atomoxetine, etc.) and wants objective evidence of how it's affecting their brain. Parents often find it reassuring to see measurable changes — see our parent's guide to children's medication. Psychiatrists value having quantitative data to inform dosage reviews.

How ADHD medication changes brain activity — and how we measure it

The dopamine hypothesis and cortical arousal

ADHD is associated with dysregulation of the dopaminergic and noradrenergic neurotransmitter systems, particularly in the prefrontal cortex. This results in a measurable pattern on qEEG: elevated theta (slow-wave) activity relative to beta (fast-wave) activity at the central and frontal midline — the theta/beta ratio (TBR). The prefrontal cortex, which governs executive function, sustained attention, and impulse control, operates at a lower arousal state than typical. This cortical underarousal is why individuals with ADHD often struggle with routine, low-reward tasks despite being perfectly capable of focusing on inherently stimulating activities.

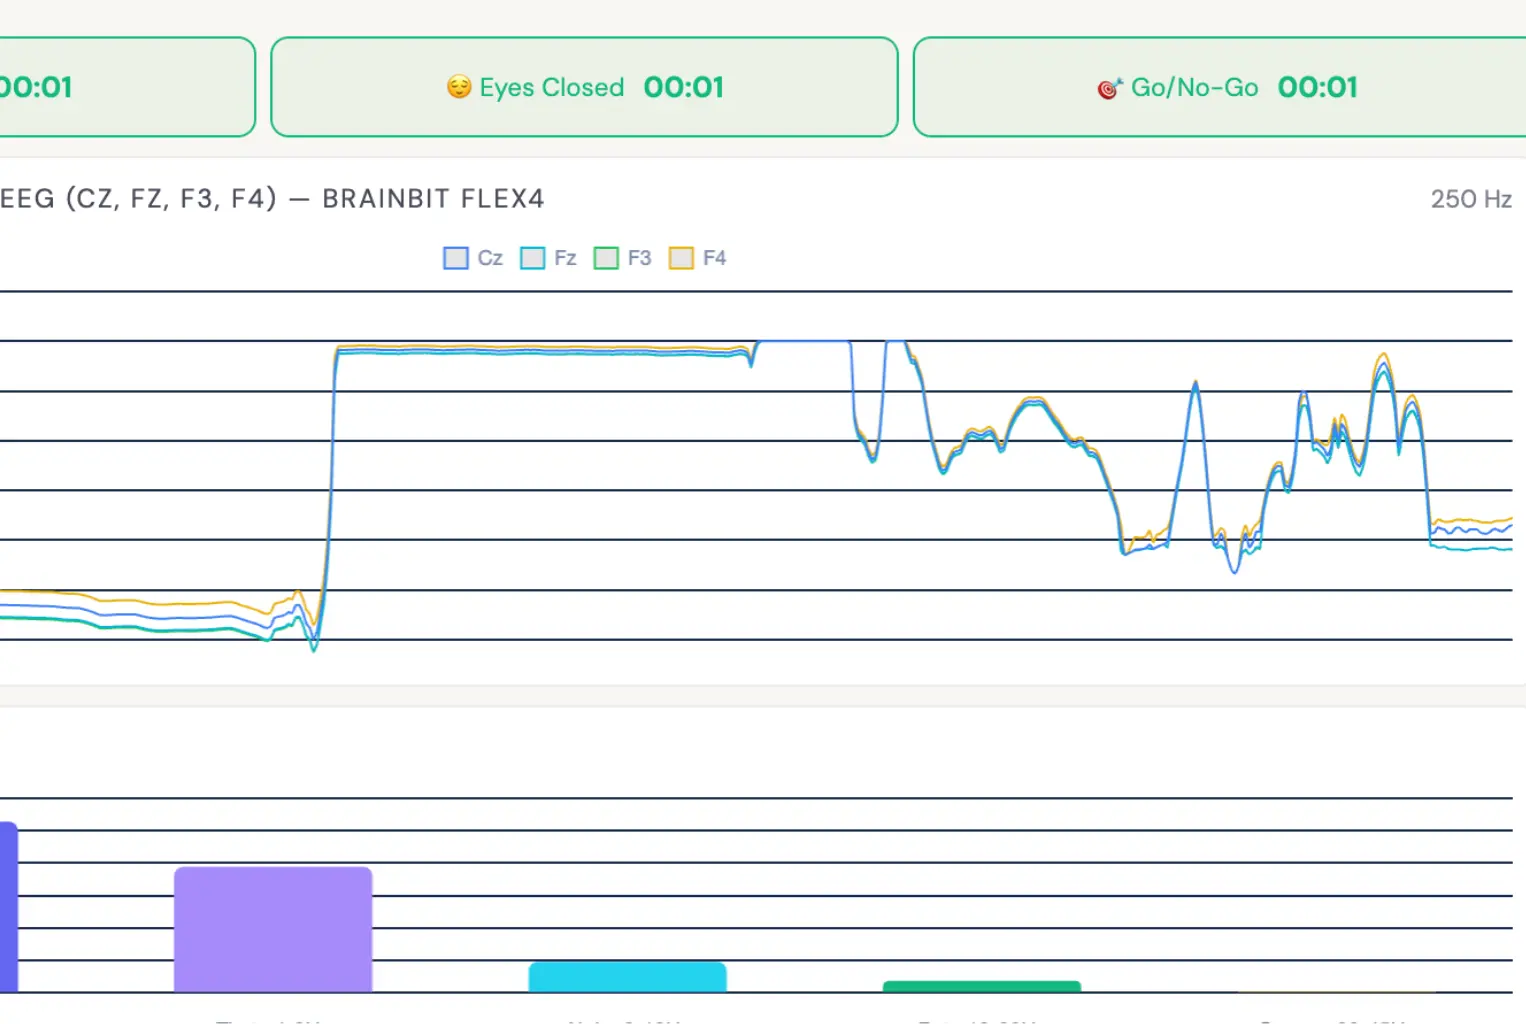
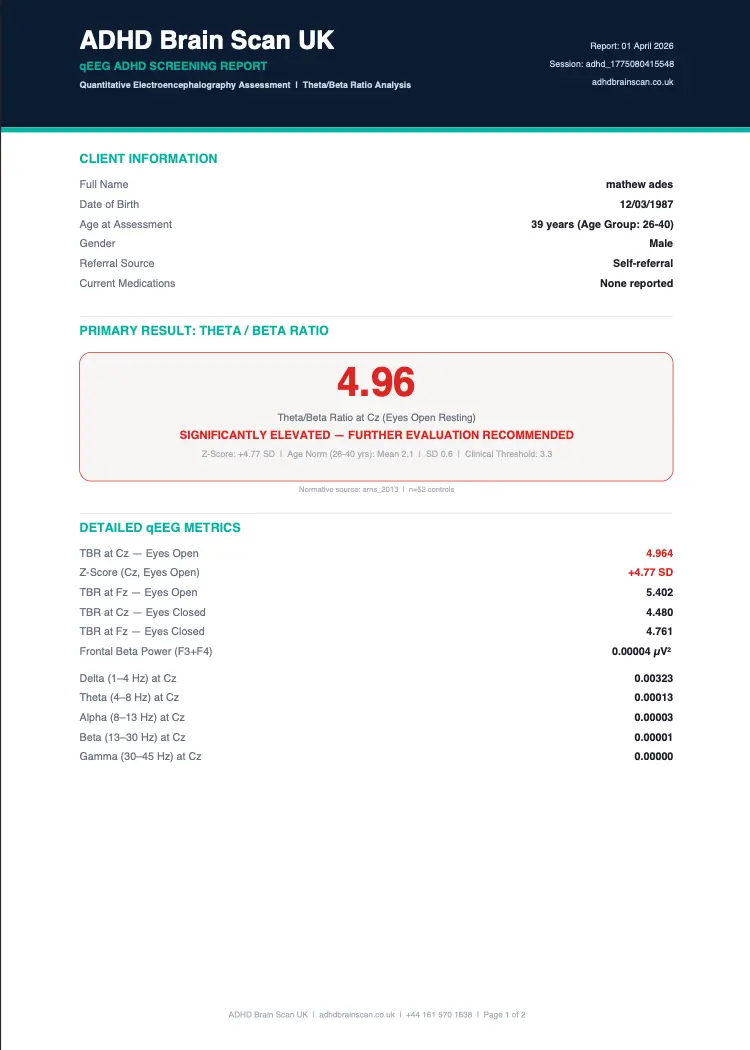
Stimulant medications — methylphenidate (Ritalin, Concerta, Equasym) and lisdexamfetamine (Elvanse) — work by increasing dopamine and noradrenaline availability in the prefrontal cortex. This raises cortical arousal to more typical levels, making it easier to sustain attention and regulate impulses. On qEEG, this manifests as a measurable decrease in the theta/beta ratio: theta power reduces as the brain becomes less dominated by slow-wave activity, and beta power increases as cortical alertness rises. The FDA-cleared NEBA System was built on exactly this principle — that TBR reflects cortical arousal and responds predictably to effective ADHD treatment.

Non-stimulant medications work through different mechanisms but produce overlapping neurological effects. Atomoxetine (Strattera) selectively increases noradrenaline in the prefrontal cortex, improving signal-to-noise ratio and sustained attention. Guanfacine (Intuniv) acts on alpha-2A adrenergic receptors to strengthen prefrontal network connectivity. While these medications take longer to reach full effect (6-8 weeks versus days for stimulants), they can also produce measurable changes in EEG patterns that our comparison scan detects. Research published by Arns et al. (2013) and others has confirmed that TBR normalisation is a reliable indicator of treatment response across multiple medication classes.

Why objective medication monitoring matters

Traditional ADHD medication monitoring relies primarily on subjective reports: "Do you feel more focused?", "Has your child's behaviour improved at school?", "Are the side effects manageable?". While these observations are valuable, they are influenced by expectation effects, day-to-day variability, observer bias, and the difficulty of accurately assessing your own cognitive function. A parent may notice their child is calmer but cannot tell whether the underlying brain activity has actually changed. An adult may feel "different" on medication but struggle to quantify whether their attention has genuinely improved.

Our medication comparison scan removes the guesswork. By comparing your theta/beta ratio, full frequency spectrum, and Go/No-Go attention task performance before and after medication, we provide hard numbers. If your TBR has dropped from a z-score of +2.3 to +0.8, that is objective evidence of normalisation. If your omission errors on the attention task dropped from 12 to 2, that is measurable improvement in sustained attention. If your reaction time variability halved, that shows your brain is maintaining more consistent focus. These are the kind of data points that inform evidence-based treatment decisions — data your prescribing clinician can use alongside their clinical observations during medication titration and annual reviews.

The NHS recommends regular medication reviews for all ADHD patients, and NICE guidelines (NG87) specify that treatment should be reviewed at least annually with consideration of whether the medication remains effective. Despite this, most reviews rely entirely on subjective reports. Adding objective qEEG data to these reviews gives prescribers a neurological dimension they would not otherwise have. Several psychiatrists and GPs in the North West now actively recommend our comparison scans as part of their titration and review protocols, because the percentage-change data in our reports provides exactly the kind of objective evidence needed for shared care agreements between primary and secondary care.

For Access to Work applications and workplace reasonable adjustment requests, demonstrating that medication is producing objective neurological improvement strengthens your case significantly. Similarly, for children's EHCP reviews, showing measurable before-and-after brain data provides the kind of quantifiable evidence that education authorities find compelling when assessing ongoing support needs.

What the side-by-side comparison report includes

The medication comparison report is structured as a direct before-and-after comparison, presenting your baseline (off-medication) data alongside your on-medication data for every metric. This makes changes immediately visible to both you and your clinician.

Theta/beta ratio comparison

The centrepiece of the report is your TBR at electrodes Cz and Fz, shown side by side with percentage change calculations. A clinically meaningful response typically shows a TBR reduction of 15-40% at Cz, bringing the z-score closer to the population average. The report presents both absolute values and z-scores against our normative database of 311+ research subjects from Monastra et al. (1999) and other published sources.

Full frequency spectrum comparison

The complete spectral decomposition across delta, theta, alpha, beta, and gamma bands is presented for both conditions. Effective stimulant medication typically shows reduced theta power, increased beta power, and a shift in the overall spectral profile toward higher-frequency dominance. The report highlights any clinically significant changes in each band.

Attention task comparison

Your Go/No-Go sustained attention task results are compared across all four metrics: mean reaction time, omission errors (inattention), commission errors (impulsivity), and reaction time variability (consistency). Many clients find this the most intuitive part of the report — seeing that your omission errors dropped from 8 to 1, or that your reaction time variability halved, makes the medication effect tangible and understandable. Our results explained guide covers each metric in detail.

Clinical interpretation and next steps

The report concludes with a clinical context section citing published literature on expected medication effects, an interpretation of your specific changes, and guidance on what the data suggests for your treatment pathway. This might include continuing at current dose (if TBR has normalised), discussing a dose increase with your prescriber (if changes are partial), or exploring alternative medications (if minimal neurological change is observed). The report is designed for presentation to your prescribing psychiatrist, GP, or shared care pharmacist during medication reviews.

When a medication comparison scan is most valuable

Starting a new medication: You have recently been prescribed methylphenidate, lisdexamfetamine, or another ADHD medication and want objective evidence that it is producing the expected neurological change. We recommend waiting at least 2-4 weeks on stimulants or 6-8 weeks on non-stimulants at your target dose before scanning.

Dose adjustment decisions: Your prescriber is considering increasing or decreasing your dose. A comparison scan shows whether the current dose is already normalising your brain activity (suggesting the dose is sufficient) or whether further adjustment may be needed. Several of our clients have avoided unnecessary dose increases after scan data showed their TBR had already normalised at the current level.

Switching medications: You are moving from one medication to another — for example, from methylphenidate to lisdexamfetamine, or from stimulant to non-stimulant — and want to compare the neurological effects of each. Some clients scan on each medication to see which produces a better objective response, providing data to guide the decision in partnership with their prescriber.

Annual medication reviews: Under NICE guidelines (NG87), ADHD medication should be reviewed at least annually. A comparison scan provides objective longitudinal data showing whether the medication continues to be effective, whether tolerance may be developing, or whether changes have occurred. Some clients scan every 6 months to build a comprehensive picture of their treatment response over time.

Reassurance for parents: Parents of children on medication often want objective confirmation that the treatment is working. Seeing measurable changes in their child's brain activity — reduced theta, increased beta, improved attention task scores — provides confidence that the medication decision was the right one. This is particularly valuable for families who feel uncertain about medicating their child. Our parent's guide and medication guide provide comprehensive information about all UK ADHD medication options including side effects, titration, and what to expect.

ADHD medications prescribed in the UK and how they affect brain activity

Understanding how different ADHD medications work at a neurological level helps you interpret your comparison scan results and have informed conversations with your prescriber. The NICE guidelines (NG87) recommend methylphenidate as first-line treatment for children and either methylphenidate or lisdexamfetamine for adults. Our full medication guide covers all options in detail including dosages, side effects, and titration schedules.

Methylphenidate (Ritalin, Concerta, Equasym, Medikinet)

Methylphenidate is the most commonly prescribed ADHD medication in the UK. It works by blocking the reuptake of dopamine and noradrenaline in the prefrontal cortex, increasing the availability of these neurotransmitters at the synapse. On qEEG, effective methylphenidate treatment typically produces a measurable reduction in theta power and an increase in beta power, resulting in a lower theta/beta ratio. The effect is rapid — immediate-release formulations produce detectable EEG changes within 30-60 minutes, while modified-release versions (Concerta XL, Equasym XL) produce sustained changes throughout the day. Our comparison scan captures these changes by measuring your brain activity on medication and comparing it against your off-medication baseline. Research by Monastra et al. (1999) was among the first to demonstrate that TBR normalisation on methylphenidate correlated with clinical improvement.

Lisdexamfetamine (Elvanse)

Lisdexamfetamine is a prodrug that is converted to dexamfetamine in the body. It increases both dopamine and noradrenaline release in the prefrontal cortex, producing a broader neurochemical effect than methylphenidate. On qEEG, lisdexamfetamine typically produces a robust reduction in theta/beta ratio, often with a more pronounced increase in beta power compared to methylphenidate. The sustained-release pharmacokinetics mean the EEG effect is consistent throughout the day, making it particularly suitable for our comparison protocol. Many of our adult clients are prescribed Elvanse, and the before-and-after TBR changes are often the most dramatic we see. If you are switching between methylphenidate and lisdexamfetamine, scanning on each can provide objective data about which medication produces a better neurological response for your individual brain.

Atomoxetine (Strattera)

Atomoxetine is a selective noradrenaline reuptake inhibitor — a non-stimulant option that works differently from methylphenidate and lisdexamfetamine. It does not directly increase dopamine levels but improves noradrenergic signalling in the prefrontal cortex, enhancing the brain's signal-to-noise ratio and sustained attention capacity. Because atomoxetine takes 6-8 weeks to reach full therapeutic effect, EEG changes develop more gradually. We recommend waiting at least 6-8 weeks at target dose before a comparison scan. The TBR reduction on atomoxetine is typically more modest than on stimulants, but the attention task improvements — particularly in reaction time variability and omission errors — can be clinically significant. If your comparison scan shows minimal TBR change on atomoxetine but clear attention task improvement, that is still a positive treatment response reflecting the noradrenergic mechanism.

Guanfacine (Intuniv)

Guanfacine is an alpha-2A adrenergic receptor agonist prescribed for children and adolescents when stimulants are not suitable or as an adjunct to stimulant treatment. It works by strengthening prefrontal cortical network connectivity rather than directly increasing neurotransmitter levels. The EEG effects of guanfacine are subtler and may manifest primarily as increased alpha coherence and improved attention task performance rather than large TBR reductions. For children on guanfacine, the Go/No-Go attention task comparison is often the most informative metric. If your child is on combination treatment (stimulant plus guanfacine), the comparison scan captures the cumulative effect of both medications on brain activity.

Comparing medications objectively

One of the most powerful applications of our medication comparison scan is switching between medications with objective data. Rather than relying solely on subjective impressions of which medication "feels better", you can scan on each medication and compare the neurological data side by side. This requires coordinating with your prescriber to manage the transition safely, but the result is objective evidence showing which medication produces a better theta/beta ratio normalisation, better attention task performance, or a more balanced spectral profile for your individual brain. This data empowers both you and your clinician to make truly evidence-based treatment decisions.

Each person's neurochemistry is different, and the medication that works best for one individual may not be optimal for another. Some people respond strongly to methylphenidate but poorly to lisdexamfetamine, while others show the opposite pattern. Without objective measurement, identifying the optimal medication relies on trial and error guided only by subjective reporting. Our comparison scans add a quantitative dimension to this process, potentially reducing the time and frustration of finding the right medication by providing clear neurological evidence of each medication's effect on your specific brain. Whether you are on the NHS pathway or seeing a private psychiatrist, our comparison data adds a neurological dimension to medication review that subjective reports alone cannot provide.

Same process, same precision — just faster the second time

The medication comparison scan uses the identical seven-minute protocol as your original screening. Same cap, same electrodes, same positions — ensuring a like-for-like comparison of your brain activity on and off medication.
Close-up of lightweight EEG cap with four electrodes during an ADHD brain screening session at ADHD Brain Scan UK
Lightweight EEG cap with four electrodes
Electrodes at Cz, Fz, F3 and F4 — the exact same positions as your baseline scan, ensuring accurate before-and-after comparison.
Laptop screen showing live EEG brainwave data during ADHD medication comparison scan with client in background
Real-time brain wave data
Watch your brain activity on screen during the recording. Your on-medication data is compared against your original baseline to calculate percentage changes in TBR and attention metrics.
Scroll for more →

What your professional reports look like

ADHD Brain Scan UK professional PDF report showing theta beta ratio z-scores
Individual child report
Each child receives their own report with age-matched z-scores and normative comparisons.
Detailed qEEG frequency band analysis and attention task results
Detailed results breakdown
Full frequency spectrum and Go/No-Go attention task results for each child individually.

Screening protocol reviewed by qualified professionals

MS
Mathew Sherborne
Founder & Lead EEG Technician — ADHD Brain Scan UK

Certified EEG technician with hands-on experience conducting over 200 qEEG screenings for children, adolescents, and adults. Our screening protocol is based on the FDA-cleared NEBA System methodology (2013) and normative data from six published peer-reviewed sources.

Last reviewed: April 2026  ·  Sources: Arns et al. (2013), Monastra et al. (1999), FDA NEBA Clearance, NICE NG87

Need a baseline scan first?

You'll need an initial ADHD Brain Screening (£595) or Comprehensive Assessment (£845) before a medication comparison makes sense. The Family Package (£1,095) is also available. See all pricing.

This service requires a previous scan to compare against. If you haven't had an initial screening, start with our ADHD Brain Screening (£595) to establish your baseline.

Book initial screening →
4.9
★★★★★
Based on 199 verified reviews
★★★★★
Did the medication comparison scan after starting Elvanse. Seeing the before/after TBR data was incredible — proper evidence my meds are doing what they should. My psychiatrist loved it.
DM
Daniel Moore
Medication scan · March 2026
Verified client
★★★★★
We wanted proof that our son's Concerta was actually working. The comparison scan showed a clear drop in his theta/beta ratio. Gave us real confidence in the treatment plan.
KF
Karen Fletcher
Parent · February 2026
Verified client
★★★★★
I use these comparison reports during medication titration reviews. Having objective EEG data alongside clinical observation makes dosage decisions much more evidence-based.
AP
Dr Anika Patel
Psychiatrist · March 2026
Healthcare professional
★★★★★
I'd been on methylphenidate for 6 months but wasn't sure if it was making a difference. The comparison scan showed my beta power had increased significantly. Objective proof — not just feelings.
SH
Sophie Henderson
Adult · February 2026
Verified client
★★★★☆
Good service but worth noting you need a baseline scan first — I hadn't realised that before booking. Once I'd done both scans the comparison report was really insightful. Clear before/after data.
MR
Marcus Reid
Adult · January 2026
Verified client
★★★★★
My son's psychiatrist was considering increasing his dose. We did the comparison scan and it showed the current dose was already normalising his TBR. Saved us an unnecessary increase.
JW
Jenny Walker
Parent · March 2026
Verified client
★★★★★
Switched from Ritalin to Elvanse and wanted to see the difference objectively. The side-by-side report was brilliant — you could clearly see different patterns between the two medications.
CT
Chris Taylor
Medication comparison · February 2026
Verified client
★★★★★
As a GP, I've started suggesting patients get comparison scans during titration. The percentage change data in the reports is exactly the kind of objective evidence I need for shared care reviews.
RK
Dr Robert Keane
General practitioner · March 2026
Healthcare professional
★★★★★
The attention task comparison was the most useful part. My reaction time improved by 80ms and my omission errors dropped to zero on medication. Numbers don't lie.
LB
Lisa Bennett
Adult · January 2026
Verified client
★★★★★
My daughter was reluctant about medication. Showing her the actual brain data — how her theta dropped and beta increased — helped her understand why the medication matters. Really powerful.
AN
Amanda Norris
Parent · March 2026
Verified client
★★★★★
Drove over from Stockport for the rescan. Quick, professional, report emailed within hours. The comparison clearly showed my atomoxetine is working. Great for my annual medication review.
PG
Paul Gibson
Medication scan · February 2026
Verified client
★★★★☆
Interesting experience. My TBR didn't change much on my current medication which has prompted a conversation with my psychiatrist about alternatives. In a way, that's exactly the data I needed.
FC
Fiona Campbell
Adult · March 2026
Verified client
★★★★★
Third comparison scan now — I get one every 6 months to track how things are going. The longitudinal data is fascinating. You can see the trend improving over time. Absolutely worth it.
IO
Ian O'Sullivan
Returning client · March 2026
Verified client
Scroll for more reviews →

Common questions about medication comparison scans

Yes. The medication comparison scan works by comparing your current brain activity against a previous recording. If you haven't had an initial scan with us, you'll need to book our ADHD Brain Screening (£595) first to establish your baseline. We can then compare subsequent scans against that baseline.

For a medication comparison scan, yes — take your medication as normal before the appointment. We want to capture your brain activity while the medication is active. The whole point is to measure how your medicated brain compares to your unmedicated baseline. If you're comparing two different medications, discuss timing with your prescribing clinician.

We can compare brain activity on any ADHD medication including methylphenidate (Ritalin, Concerta, Equasym), lisdexamfetamine (Elvanse/Vyvanse), dexamfetamine, atomoxetine (Strattera), and guanfacine (Intuniv). The scan measures brain wave patterns regardless of the specific medication — what we're looking for is the change in your theta/beta ratio and attention metrics.

For stimulant medications (methylphenidate, Elvanse), you can scan once you've reached a stable dose — typically 4-6 weeks after starting or adjusting. For non-stimulants like atomoxetine, allow 6-8 weeks as these take longer to reach full effect. Your prescribing clinician can advise on the optimal timing.

The report shows a side-by-side comparison of your baseline and current scan, including: theta/beta ratio change at Cz and Fz, full frequency band power changes, Go/No-Go attention task performance comparison (reaction time, omission rate, commission rate), and percentage change calculations for each metric. Our results explained guide helps you interpret every data point.

The scan provides objective data that can inform dosage decisions as part of the wider diagnosis and treatment journey, but it doesn't prescribe dosage changes. If your TBR has normalised and your attention metrics have improved, that's a positive indicator. If there's minimal change, that data can support a conversation with your psychiatrist about adjusting the dose or trying an alternative. The data informs — your clinician decides. Our medication guide covers titration, side effects and what to expect from each UK medication.

Absolutely. If you're switching from one medication to another, we can scan you on each and provide a three-way comparison: baseline (unmedicated) vs medication A vs medication B. This gives you and your clinician objective data on which medication produces a more favourable brain activity profile for you specifically.

Identical. Same cap placement, same 7-minute protocol (eyes-open, eyes-closed, Go/No-Go task), same electrode sites. This is essential — consistent methodology means any changes in the results are attributable to the medication, not differences in the recording procedure.

Our reports include peer-reviewed citations, z-scores, and clear percentage change data presented in a clinical format. Several psychiatrists in the region already use our comparison reports during medication reviews. Learn more about psychiatric assessment. The objective before/after data gives them an additional evidence point alongside their clinical observations and your subjective feedback. Our GP appointment guide includes scripts for presenting data at reviews.

We recommend a scan whenever there's a meaningful change: starting medication, changing dose, switching medication, or as part of an annual medication review. Some clients scan every 6 months to track longitudinal trends. There's no clinical limit — the scan is completely non-invasive and safe to repeat as often as needed.

What happens during a screening

A 60-second look at the ADHD brain screening experience.

Book your ADHD Medication Comparison Scan

Secure online payment. We'll confirm your appointment within 24 hours.

£345
Book today
Secure payment powered by Stripe
Need a baseline? Standard (£595) · Comprehensive (£845) · Family (£1,095)
Support: ADHD support hub · medication guide · follow-up scan info · results explained
Screening: women & girls · teenagers · children 6+ · adults