Private ADHD assessments give you a clinician's opinion based on conversation. We give you quantitative brain data based on decades of published neuroscience. Here's the science that makes it possible.
Every brain produces electrical signals as neurons communicate with each other. These signals oscillate at different frequencies, and we can measure them from the scalp using electroencephalography (EEG). In people with ADHD, research consistently shows that the pattern of these oscillations is different from the general population.
Specifically, the ADHD brain tends to produce more theta activity (slow waves associated with drowsiness, mind-wandering, and unfocused states) and less beta activity (faster waves associated with alertness, focused attention, and active processing). This imbalance is quantified as the theta/beta ratio (TBR) — and it's the most extensively studied EEG biomarker for ADHD in the scientific literature.
The prevailing neurological model for ADHD is cortical hypoarousal. The frontal cortex — responsible for executive function, sustained attention, impulse control, and working memory — operates at a lower arousal state than typical. This isn't laziness or a lack of effort. The ADHD brain is often working harder to achieve the same level of focus, because the neurological baseline makes sustained attention physiologically more difficult. Our guide to the ADHD brain explains how this affects dopamine, working memory and emotional regulation in everyday life.
This is why stimulant medications (methylphenidate, amphetamines) work paradoxically in ADHD: they increase cortical arousal to a more typical level, making it easier to focus. It's also why the theta/beta ratio tends to normalise when effective medication is taken — something we can objectively measure with a pre/post medication comparison scan. See our full medication guide for all UK options including titration and side effects.
Raw EEG power values vary enormously between individuals due to skull thickness, scalp conductance, and electrode contact quality. But the ratio between two frequency bands measured at the same electrode is remarkably stable — because whatever is affecting the absolute values affects both bands equally. This is what makes TBR a robust biomarker: it's self-normalising.
An elevated TBR — typically above 3.0-4.5 depending on age group — suggests the brain's balance is tipped toward slow-wave dominance. In the context of ADHD symptoms (inattention, hyperactivity, impulsivity), this provides objective neurological evidence that the frontal cortex may not be achieving adequate arousal for sustained attention.
Quantitative electroencephalography (qEEG) is a method of recording and analysing the electrical activity produced by the brain. It has been used in clinical neurology since the 1920s, when German psychiatrist Hans Berger first demonstrated that electrical potentials could be measured from the human scalp. Modern qEEG builds on this foundation by applying digital signal processing techniques to extract precise frequency-domain information from raw EEG recordings.
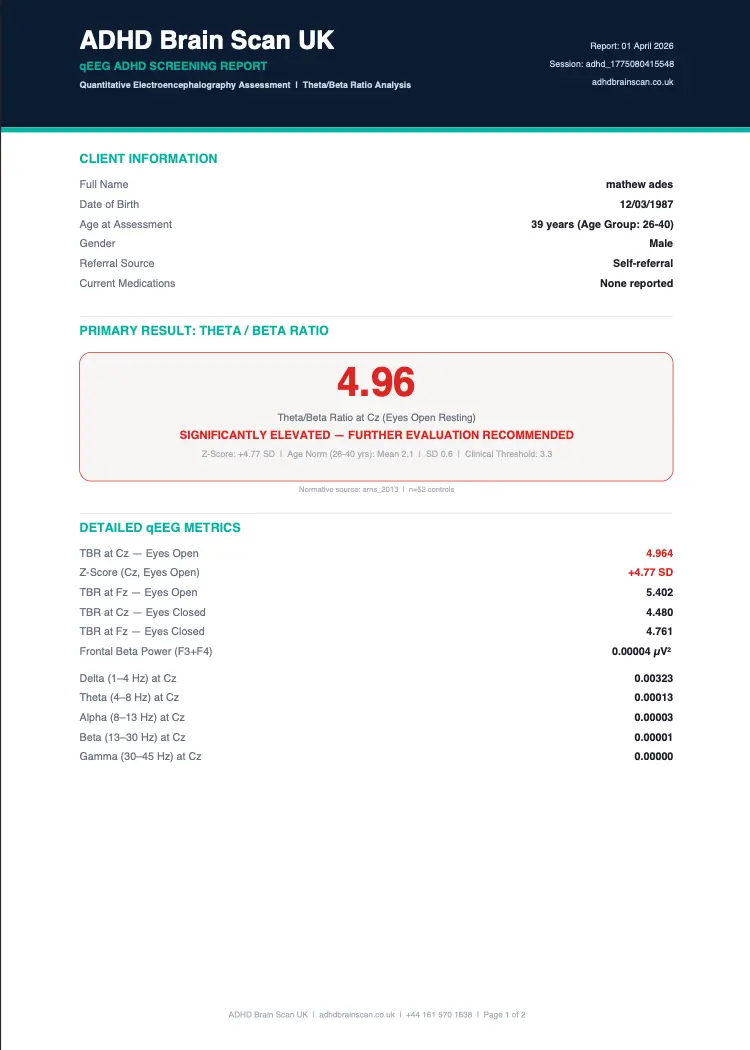
Our screening uses four electrode sites positioned according to the international 10-20 system, a standardised method for placing EEG electrodes that ensures consistent measurement locations across different subjects and sessions. The primary sites are Cz (central midline, at the vertex of the scalp) and Fz (frontal midline, above the forehead), with supplementary recordings at F3 (left frontal) and F4 (right frontal). Electrode Cz is the critical measurement point — this is the exact site specified in the FDA's NEBA System clearance and the site used in the majority of published ADHD TBR research. The frontal sites provide additional data on executive function regions and help identify lateralised differences in cortical arousal.
The electrodes detect microvolt-level electrical potentials generated by synchronised neuronal activity in the cerebral cortex. These raw signals are amplified, digitised at a sampling rate sufficient to capture frequencies up to 45 Hz, and then processed using Fast Fourier Transform (FFT) analysis. The FFT decomposes the complex raw EEG signal into its constituent frequency components, revealing how much power (measured in microvolts squared per hertz) is present at each frequency. This is analogous to splitting white light through a prism to reveal its component colours — except instead of colours, we see the relative contributions of delta, theta, alpha, beta, and gamma frequency bands.
Raw EEG data contains artifacts from sources other than brain activity, including eye blinks, muscle tension, jaw clenching, and electrical interference. Our processing pipeline identifies and removes these artifacts before computing the final frequency analysis. This is critical because muscle artifacts can artificially inflate beta power, and eye movement artifacts can contaminate frontal recordings. Each recording undergoes visual inspection and automated artifact rejection to ensure the computed theta/beta ratio reflects genuine cortical activity rather than noise. We also monitor impedance (the electrical contact quality between electrode and scalp) throughout the recording to ensure signal quality meets clinical standards.
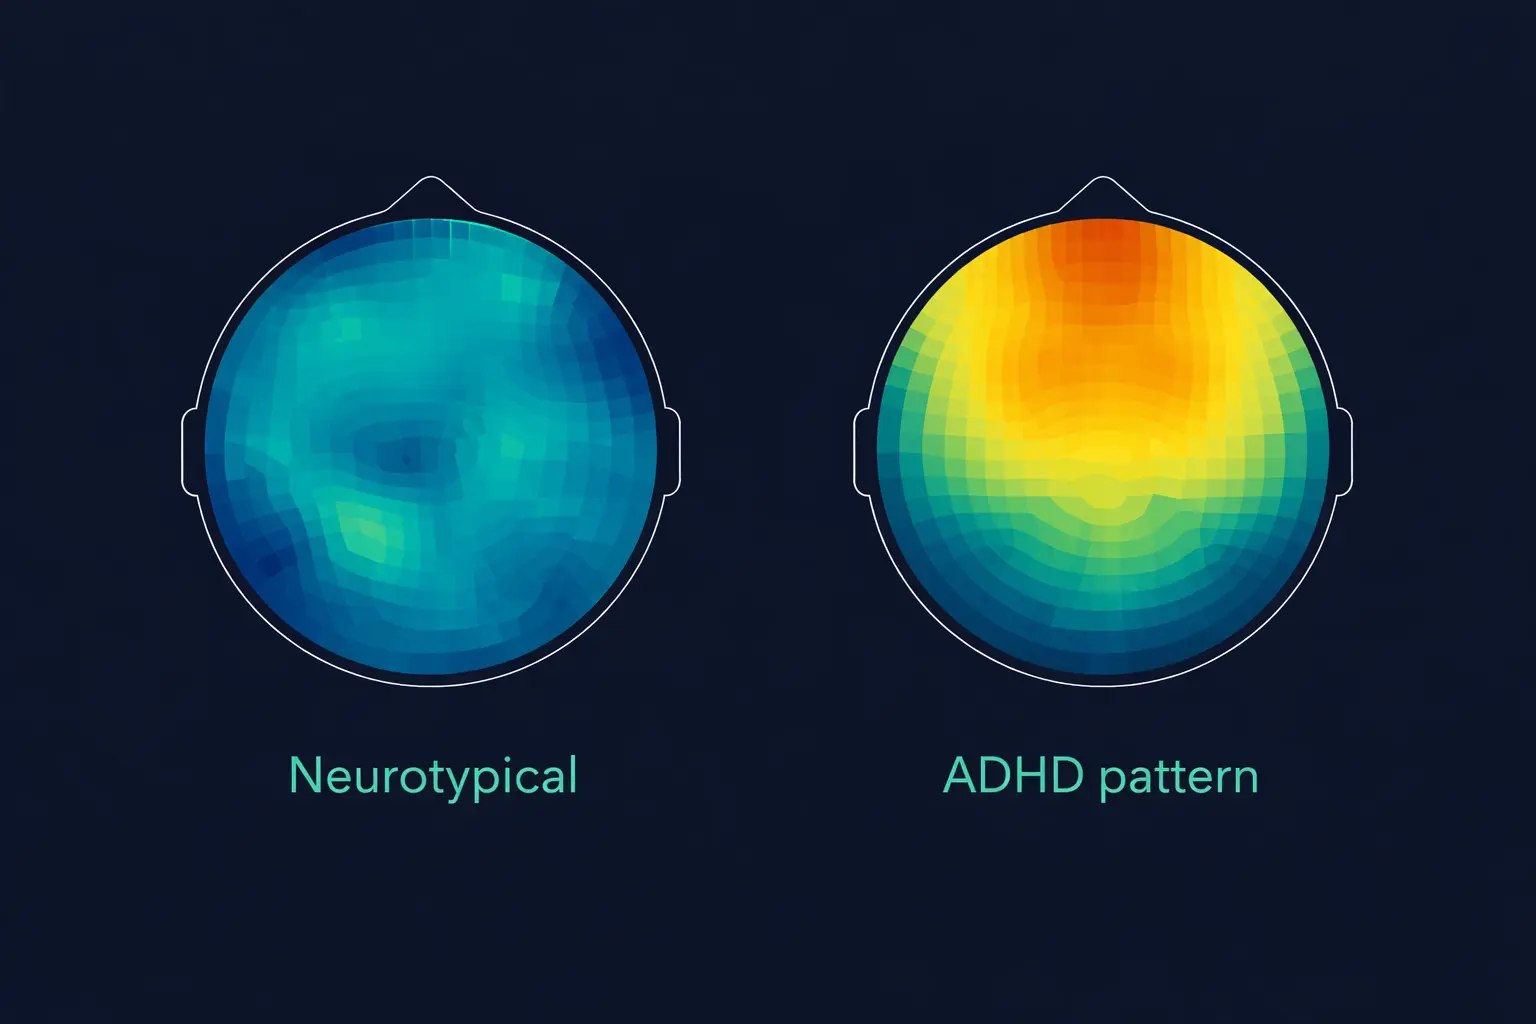
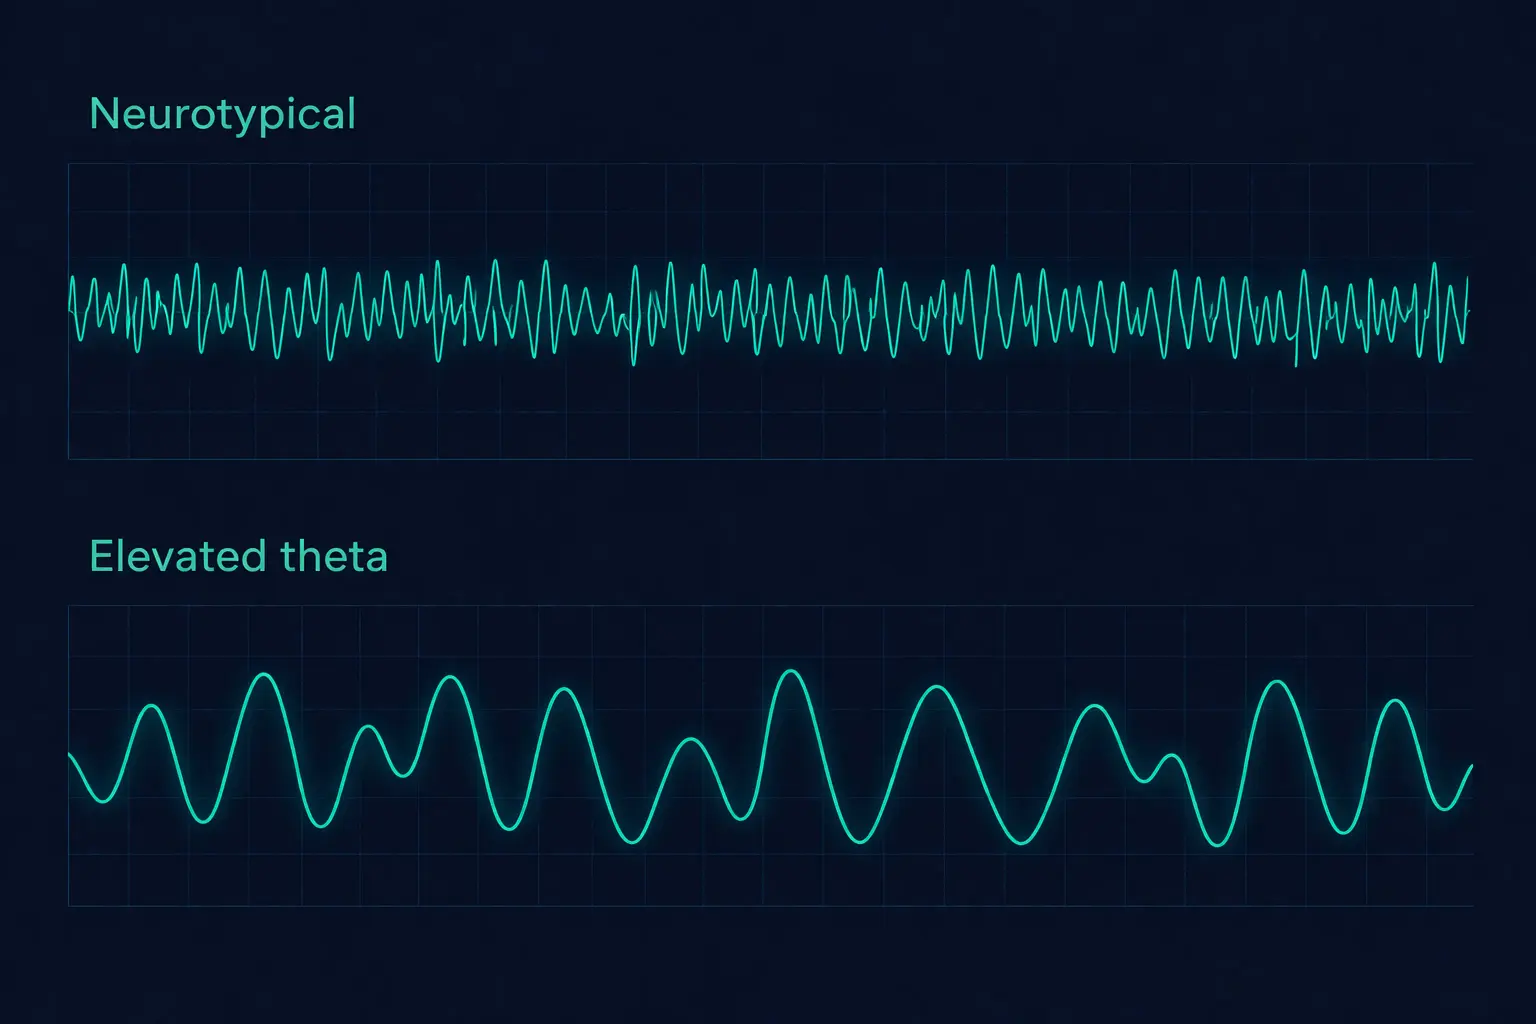
The cortical hypoarousal pattern measured by qEEG reflects underlying neurochemical differences in the ADHD brain. Research from neuroimaging and pharmacological studies has established that ADHD involves dysregulation of the dopaminergic and noradrenergic neurotransmitter systems, particularly in the prefrontal cortex and its connections to the basal ganglia and cerebellum. Dopamine plays a critical role in sustaining attention, filtering irrelevant stimuli, maintaining motivation for non-rewarding tasks, and regulating executive function. In ADHD, dopamine signalling in the prefrontal cortex is believed to be insufficient, leading to reduced cortical arousal that manifests as elevated slow-wave (theta) activity on EEG.
This dopamine hypothesis explains several key observations. First, it explains why stimulant medications (methylphenidate, lisdexamfetamine) are effective in ADHD — they increase dopamine availability in the prefrontal cortex, raising cortical arousal to more typical levels. Second, it explains why the theta/beta ratio tends to normalise when effective medication is taken, something we can objectively measure with a pre/post medication comparison scan. Third, it explains why individuals with ADHD often perform well on tasks that are inherently stimulating or novel (which naturally increase dopamine) but struggle with routine, repetitive, or low-reward tasks (which do not). The qEEG captures this prefrontal arousal state directly, providing a neurological snapshot that complements the behavioural observations made during clinical assessment.
Norepinephrine, the second key neurotransmitter implicated in ADHD, regulates alertness and the brain's signal-to-noise ratio — its ability to distinguish important stimuli from background noise. Reduced noradrenergic function contributes to the distractibility and difficulty filtering irrelevant information that characterises ADHD. Medications like atomoxetine and guanfacine target this system specifically. While qEEG cannot directly measure neurotransmitter levels, the cortical arousal patterns it detects are the downstream consequence of these neurochemical differences, making the theta/beta ratio an indirect but reliable indicator of the underlying neurobiology. For a full overview of UK medication options, see our ADHD medication guide.
The journey from research finding to clinical tool took decades. Here are the key milestones that established TBR as a credible ADHD biomarker:
Published in the journal Biological Psychiatry, this landmark study demonstrated that TBR at electrode Cz could differentiate ADHD from non-ADHD children with high accuracy. It established the clinical protocol still used today and set age-specific thresholds that became the basis for normative databases.
Australian researchers showed that different ADHD subtypes produce distinct EEG profiles. Combined-type ADHD showed elevated theta/beta, while predominantly inattentive type showed different patterns. This was significant because it demonstrated EEG's potential to provide subtype information that questionnaires alone cannot.
A Norwegian study validated the clinical utility of TBR in a large sample, confirming that elevated theta/beta ratio at Cz was a consistent finding across multiple clinical settings, not just controlled research environments. This helped bridge the gap between laboratory research and real-world clinical application. Our screening uses the same methodology — see how it works.
The United States Food and Drug Administration cleared the Neuropsychiatric EEG-Based Assessment Aid (NEBA) System as the first brain wave test to help assess ADHD in patients aged 6-17. The device measures theta and beta frequencies at electrode Cz and computes the ratio. The FDA determined it was safe and effective as a diagnostic aid when used alongside standard clinical evaluation.
Published in the Journal of the American Academy of Child and Adolescent Psychiatry, this meta-analysis pooled data from 1,498 ADHD subjects and 1,289 controls across multiple studies. It confirmed that TBR is significantly elevated in ADHD with a large effect size (d = 0.62), establishing it as the single most replicated neurobiological finding in ADHD research.
The American Academy of Neurology published a practice advisory confirming that TBR-based EEG assessment has clinical value as a supplementary tool. They reported accuracy of 89-94% when combined with clinical evaluation, and recommended it should not be used as a standalone diagnostic but acknowledged its significant value as supportive evidence.
Your brain produces electrical oscillations across a spectrum of frequencies. We decompose this spectrum into five standard bands using Fast Fourier Transform (FFT) analysis. Each band reflects a different aspect of your brain's functional state.
In a typical ADHD profile, you see elevated theta relative to beta — particularly at electrode Cz (central midline) and Fz (frontal midline). The frontal electrodes (F3, F4) provide additional data on beta power in the left and right frontal cortex, where executive function is primarily regulated.
Every brain screening is only as good as the reference data it's compared against. We've built our normative database from six peer-reviewed research sources supplemented by computed norms from open-access EEG datasets containing 311 real subjects.
Our computed norms (used in every screening and family package) from the Mendeley open-access dataset show a Cohen's d of 1.364 between ADHD and control groups — a large effect size confirming that TBR reliably separates ADHD from non-ADHD populations. Adult control TBR averaged 6.03 ± 5.93, while adult ADHD TBR averaged 17.19 ± 9.94 — nearly three times higher.
Every screening result in our report is expressed as a z-score — a standardised statistical measure that tells you exactly how far your brain activity deviates from the age-matched healthy average. Z-scores are used throughout clinical medicine and psychology because they provide a universal scale for comparison, regardless of what is being measured.
A z-score of 0 means your result is exactly at the population average. A z-score of +1.0 means your result is one standard deviation above the average — approximately the 84th percentile. A z-score of +2.0 means you are two standard deviations above average — the 98th percentile. For theta/beta ratio specifically, a z-score above +1.5 at electrode Cz is generally considered clinically significant for ADHD screening purposes, indicating that your TBR is substantially elevated compared to the normative population.
The advantage of z-scores over raw values is context. A raw theta/beta ratio of 4.5 means very different things for a 7-year-old child versus a 45-year-old adult, because TBR naturally decreases with age as the brain matures. By converting raw values to z-scores using age-matched normative data, we can compare any client — regardless of age — against their appropriate reference group. A z-score of +2.1 for a 7-year-old and a z-score of +2.1 for a 45-year-old both indicate the same degree of deviation from their respective age norms, even though their raw TBR values would be very different.
Our reports present z-scores both numerically and visually, using a colour-coded scale that shows where your result falls relative to the normative distribution. This makes the data immediately interpretable for clinicians who may not be familiar with qEEG technology — they can see at a glance whether your brain activity pattern is within normal limits, borderline, or significantly elevated. This visual clarity is one of the reasons GPs and psychiatrists find our reports useful for supporting referral letters and EHCP applications. Our results explained guide walks through every section of the report in detail.
| Source | Year | Subjects | Key finding |
|---|---|---|---|
| Arns et al. J Am Acad Child Adolesc Psychiatry |
2013 | 1,498 ADHD 1,289 controls |
Meta-analysis confirming elevated TBR in ADHD with effect size d=0.62. The definitive study establishing TBR as the most replicated ADHD biomarker. |
| Monastra et al. Biological Psychiatry |
1999 | 482 subjects | Foundational study demonstrating TBR at Cz differentiates ADHD from controls. Established age-specific thresholds still referenced today. |
| Clarke et al. Clinical Neurophysiology |
2001 | 184 subjects | Demonstrated distinct EEG profiles for ADHD subtypes. Combined-type shows elevated theta; inattentive type shows different patterns. |
| Ogrim et al. Behavioural and Brain Functions |
2012 | 133 subjects | Clinical validation of TBR in real-world settings. Confirmed that findings from controlled studies replicate in clinical practice. |
| Snyder et al. Clinical EEG and Neuroscience |
2015 | 275 subjects | Large-scale validation study following FDA clearance. Confirmed clinical utility of NEBA-style TBR assessment in prospective cohort. |
| Nasrabadi et al. IEEE / Mendeley Dataset |
2020 | 121 subjects | Open-access dataset with 61 ADHD + 60 control children. 19 channels, 128 Hz. We compute our own norms from this raw data. |
The current standard of care for ADHD assessment in the UK relies almost entirely on subjective tools: clinical interview, behavioural rating scales (Conners, SNAP-IV, DIVA-5), teacher observations, and developmental history. These are valuable — but they measure reported behaviour, not brain function.
A qEEG screening measures what's actually happening inside the brain. The two approaches answer different questions, and they're most powerful when used together.
We don't position qEEG as a replacement for clinical assessment — we position it as the missing piece. The American Academy of Neurology found that accuracy reaches 89-94% when TBR data is combined with clinical evaluation. That's higher than either approach alone. Your clinician brings their expertise in behavioural presentation, differential diagnosis, and treatment planning. We bring the brain data they don't have access to. Our comprehensive package (£845) includes a clinical letter designed for your GP or psychiatrist.
This is why our tagline is "private ADHD assessments give you an opinion — we give you the data." Both are necessary. But until now, only one was available. Whether you're on the NHS waiting list, pursuing Right to Choose, or going private — brain data makes every pathway stronger. Our results explained guide walks you through exactly what your report means, and our GP appointment guide includes scripts for presenting your data.
The scientific evidence behind the theta/beta ratio translates directly into practical clinical value across multiple pathways. Understanding how your qEEG data can be used helps you get the most from your screening investment.
The most common use of our screening data is to strengthen a GP referral for formal ADHD assessment. When a GP writes a referral letter to CAMHS or an adult ADHD service, having objective neurological data alongside the standard behavioural observations makes the referral significantly more compelling. Several of our clients have reported that their GP fast-tracked referrals after seeing elevated TBR z-scores in our reports, because the objective data provided the clinical justification needed to prioritise the referral. For families stuck on the NHS waiting list, this can mean the difference between years of waiting and months.
Under the NHS Right to Choose framework, patients can request referral to a private provider (such as Psychiatry-UK) for ADHD assessment at NHS cost. These referrals are more likely to be accepted when supported by objective evidence of clinical need. A qEEG report showing significantly elevated theta/beta ratio provides exactly this kind of evidence. For those pursuing fully private psychiatric assessment, presenting qEEG data to the assessing psychiatrist gives them an additional neurological data point that complements their clinical interview and behavioural rating scales.
Our reports are increasingly used to support Education, Health and Care Plan (EHCP) applications for children, where objective neurological evidence strengthens the case for additional school support, exam access arrangements, and specialist provision. For adults, the same data supports Access to Work applications and workplace reasonable adjustment requests under the Equality Act 2010. Because qEEG data is quantitative and comparable against normative databases, it carries weight in formal applications where subjective assessments alone may be questioned. See our full guide to ADHD workplace rights for more detail on what you are legally entitled to.
One of the most scientifically compelling applications of qEEG is objective medication monitoring. Because stimulant medications work by increasing cortical arousal, the theta/beta ratio typically decreases (normalises) when effective medication is taken. A pre/post medication comparison scan provides hard data showing whether your medication is producing the expected neurological change, whether a dosage adjustment might be needed, or whether a particular medication class is having the desired effect. This removes the guesswork from medication titration and gives both patients and prescribers objective evidence to guide treatment decisions.
We believe in transparent science. Here's what the theta/beta ratio does well, and where its limitations lie:
TBR is a reliable population-level biomarker. Across thousands of subjects in meta-analyses, ADHD groups consistently show elevated TBR compared to controls. It has a large effect size (d = 0.62-1.36 depending on the study), making it one of the strongest neurobiological findings in ADHD research. When combined with clinical evaluation, it improves diagnostic accuracy to 89-94%.
TBR is not a standalone diagnostic. Not all individuals with ADHD show elevated TBR — particularly those with predominantly hyperactive-impulsive presentation, or women who present with inattentive symptoms. A normal TBR does not rule out ADHD. Conversely, elevated TBR can occasionally occur in other conditions such as excessive drowsiness, certain medication effects, or fatigue. This is precisely why clinical context matters, and why our reports are designed to supplement — never replace — qualified clinical assessment.
The same meta-analysis that confirmed TBR's validity also noted that effect sizes have decreased in more recent studies compared to earlier ones. Some researchers interpret this as TBR becoming less reliable; others argue that earlier studies had more clearly differentiated samples. We take the conservative position: TBR is a clinically useful biomarker that provides valuable supporting data, and it should always be interpreted alongside comprehensive clinical evaluation. The same data supports school EHCP applications and Access to Work claims.
ADHD rarely occurs in isolation. Research published by the National Institute for Health and Care Excellence (NICE) estimates that up to 80% of individuals with ADHD have at least one co-occurring condition. Common comorbidities include anxiety disorders, depression, autism spectrum conditions, dyslexia, oppositional defiant disorder (in children), and sleep disorders. Some of these conditions can influence EEG patterns independently — for example, anxiety may increase beta activity (potentially masking an elevated TBR), while depression may increase theta activity (potentially inflating TBR even without ADHD). Sleep deprivation can significantly elevate slow-wave activity and produce a falsely elevated theta/beta ratio.
This is exactly why we emphasise that qEEG screening data should always be interpreted within a broader clinical context. A skilled clinician who reviews your qEEG report alongside your developmental history, behavioural symptoms, and any known comorbidities can distinguish between an elevated TBR caused by ADHD and one caused by other factors. Our reports include notes on recording conditions and any observations that may affect interpretation, ensuring that the clinician receiving the data has the context needed to use it appropriately.
A qEEG screening is most valuable for individuals who suspect ADHD but want objective data before committing to a full clinical assessment, families with children on long NHS waiting lists who need evidence to expedite referrals, adults who have spent years wondering whether their difficulties with focus, organisation, and time management might have a neurological basis, women and girls who are statistically underdiagnosed due to the inattentive presentation being less visible, parents who want to screen multiple siblings to identify which children may benefit from formal assessment, and individuals already on ADHD medication who want objective evidence of whether their treatment is producing the expected neurological change. If any of these situations apply to you, our ADHD brain screening provides the objective data point that traditional assessment pathways do not offer.
Certified EEG technician with hands-on experience conducting over 200 qEEG screenings. All scientific content on this page is based on published peer-reviewed research and follows the methodology established by the FDA-cleared NEBA System (2013).
Last reviewed: April 2026 · Sources: Arns et al. (2013), Monastra et al. (1999), FDA NEBA Clearance, NICE NG87
A 60-second look at the ADHD brain screening experience.
Book your ADHD brain screening and find out. Same-week appointments available.