ADHD Medication Response Scan — See Whether Your Treatment Is Changing Your Brain
In this guide
- Why a follow-up scan matters
- What we compare
- Understanding your follow-up report
- What different results mean
- When to book your follow-up
- How to prepare — factors that affect your scan
- On the day — what to expect
- Using your report at medication reviews
- Who is this for?
- Follow-up scanning for children
- Long-term monitoring — how often should you scan?
- The science behind medication response scanning
- What a follow-up scan cannot tell you
- Frequently asked questions
You have been diagnosed. You have started medication. You think it is helping. But how do you know?
Subjective self-report is unreliable. Some days feel better than others regardless of medication. Placebo effects are real. And the gradual nature of titration makes it hard to pinpoint when medication has reached its optimal effect.
A follow-up qEEG screening gives you what self-report cannot: objective before-and-after brain data. We compare your current theta/beta ratio directly against your original screening baseline. If medication is working at a neurological level, the data will show it.
Why a follow-up scan matters
Research consistently shows that stimulant medication like methylphenidate and lisdexamfetamine (Elvanse) — recommended by NICE (NG87) — increases dopamine and norepinephrine in the prefrontal cortex, normalising the activation patterns that are underactive in ADHD. Meta-analyses have shown that medication reduces abnormal under-activation in the frontostriatal and frontoparietal circuits.
In practical terms, this means that in responsive patients, the theta/beta ratio — a biomarker recognised by the FDA-cleared NEBA system — should decrease on medication — less slow-wave “rest mode” activity, more fast-wave “focus mode” activity. A follow-up scan captures this change objectively.
What a follow-up scan provides
- Objective evidence that medication is working — not relying on subjective impression but on measurable brain activity changes. This is powerful for your own confidence in treatment and for reassuring family members
- Evidence for medication reviews — your psychiatrist or GP can use the before-and-after data in annual medication reviews. Concrete brain data is more informative than “I think it’s helping”
- Early identification of non-response — if your TBR has not changed after 3–6 months of stable medication, it may indicate the current medication or dose is not reaching its target. This can prompt a discussion about dose adjustment or switching medication before months of suboptimal treatment
- Tracking progress over time — some patients book follow-up scans at multiple points: after starting medication, after a dose change, or after significant lifestyle changes like starting regular exercise
- Motivation for treatment adherence — seeing concrete brain data that shows your medication is genuinely changing your neural activity is a powerful motivator to continue treatment, especially during periods of doubt
What we compare
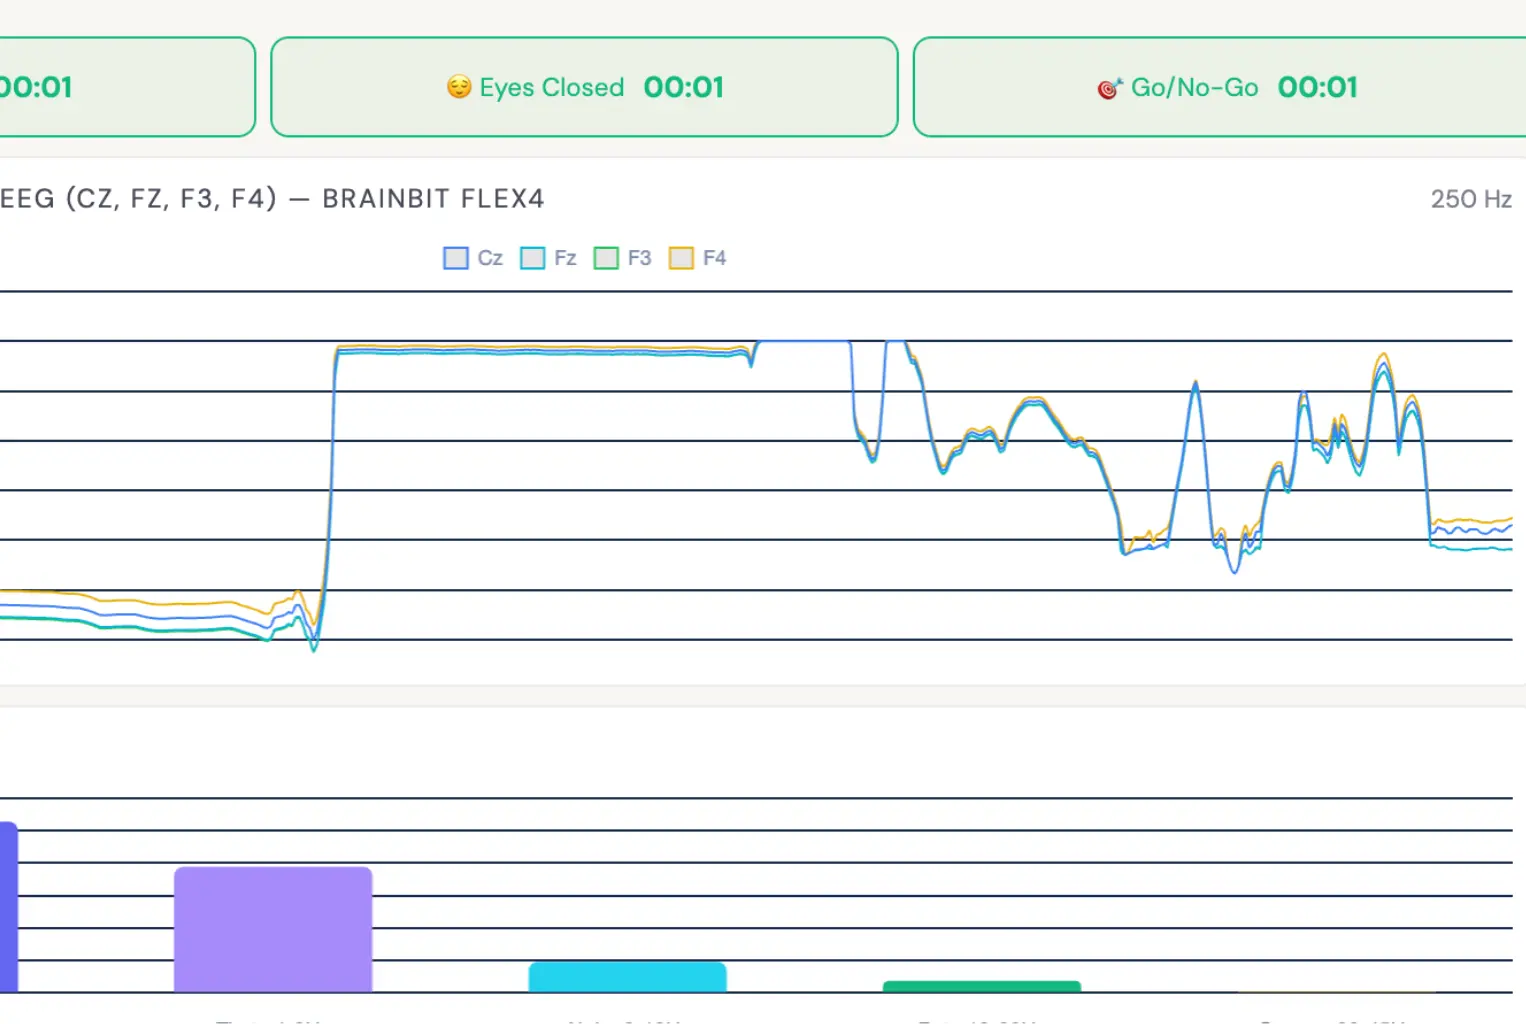
Your follow-up scan uses the identical protocol to your original screening — same electrode positions (Cz, Fz, F3, F4), same three phases (eyes-open resting, eyes-closed resting, Go/No-Go task), same normative data. This ensures a valid comparison.
Your follow-up report includes a direct comparison of:
- Theta/Beta Ratio at Cz (eyes open) — your primary biomarker. Has it decreased toward the normative mean?
- Z-score change — has your deviation from the age-matched norm reduced?
- Theta and beta power individually — has theta decreased, beta increased, or both?
- Band power across conditions — do the changes appear in eyes-open, eyes-closed, or both? Condition-specific changes provide additional clinical insight
- Go/No-Go performance — have omission rates (inattention), commission rates (impulsivity) and reaction time variability improved?
Understanding your follow-up report
Your follow-up report is designed to be shared directly with your prescriber. It presents your data clearly without requiring specialist neurophysiology training to interpret. Here is what each section contains:
Theta/Beta Ratio comparison
The centrepiece of your report. Your baseline TBR (from your original screening) is displayed alongside your follow-up TBR, with the percentage change calculated. The report also shows where both values sit relative to the age-matched normative range from our 311+ subject database. A decrease in TBR indicates that the balance between slow-wave (theta) and fast-wave (beta) activity has shifted toward the pattern seen in neurotypical individuals during concentration tasks.
Z-score trajectory
Your Z-score measures how many standard deviations your TBR sits from the population mean for your age group. A Z-score of zero means your TBR is exactly average. In your original screening, an elevated Z-score indicated atypical cortical activation. Your follow-up report tracks whether this Z-score has moved closer to zero — even a shift from +2.1 to +1.4 represents meaningful normalisation, even though the value remains above average.
Individual band power analysis
Rather than just looking at the ratio, we break down theta and beta power separately across all conditions. This matters because the same TBR improvement can occur through different mechanisms: theta decreasing (less daydreaming activity), beta increasing (more active concentration), or both. Understanding which component has shifted helps your prescriber interpret the results in the context of your clinical experience. For example, if you report improved focus but unchanged impulsivity, we might expect to see beta increase without significant theta change.
Go/No-Go cognitive performance
The Go/No-Go task is a computerised test of sustained attention and impulse control. Your follow-up report compares your performance across four metrics: omission errors (missed targets, indicating inattention), commission errors (false presses, indicating impulsivity), mean reaction time (processing speed), and reaction time variability (consistency of attention). Improvements in these metrics provide behavioural evidence that complements the neurophysiological EEG data.
What different results mean
Follow-up scan results fall into several patterns. Understanding these in advance helps you interpret your data and have a productive conversation with your prescriber:
Scenario 1: Clear TBR improvement + clinical improvement
Your TBR has decreased meaningfully (typically 15–30% or more), your Z-score has moved closer to zero, and you feel that medication is helping. This is the most straightforward outcome — the objective brain data confirms your subjective experience. This provides strong evidence to continue current treatment and is powerful documentation for annual medication reviews.
Scenario 2: Clinical improvement but minimal TBR change
You feel better on medication, but your TBR has not shifted significantly. This is more common than you might expect and does not mean medication is not working. Stimulants may be improving function through mechanisms that are not fully captured by resting-state TBR — for example, improving connectivity between brain regions rather than changing raw power ratios. In this case, clinical improvement takes priority. The scan data is still valuable because it provides a baseline for future comparison.
Scenario 3: TBR improvement but uncertain clinical benefit
Your brain data shows a clear shift toward normalisation, but you are not sure you feel different day-to-day. This can happen when medication is producing genuine neurological change that has not yet translated into noticeable functional improvement — or when gradual improvement is hard to detect from the inside. It may also suggest that the dose is working at a brain level but needs fine-tuning for optimal clinical effect. Share this data with your prescriber.
Scenario 4: No TBR change and no clinical improvement
Neither the brain data nor your experience suggest meaningful response. This is valuable information — it provides objective evidence to support a medication adjustment conversation. Your prescriber may consider increasing the dose, switching to a different stimulant (methylphenidate to lisdexamfetamine or vice versa), or exploring non-stimulant options like atomoxetine or guanfacine. Early identification of non-response prevents months of suboptimal treatment.
When to book your follow-up
The ideal timing
- 3–6 months after starting medication — once your dose has been stable for at least 4–6 weeks. This allows enough time for the medication to reach full effect and for your brain to establish a new baseline
- After a dose change or medication switch — if your specialist adjusts your medication, a follow-up scan 6–8 weeks later can assess the impact
- Before an annual medication review — bringing objective brain data to your review gives your specialist concrete evidence to inform decisions about continuing, adjusting or discontinuing medication
Other reasons to book
- After starting regular exercise — if you have built a consistent exercise routine, a follow-up scan can show whether your brain activity has shifted independently of medication
- After stopping medication — some people want to see what their brain activity looks like without medication, to inform decisions about long-term treatment
- For children starting medication — parents often find the before-and-after comparison reassuring when making medication decisions for their child
How to prepare — factors that affect your scan
A follow-up scan is only useful if the conditions are comparable to your original screening. Several factors can temporarily alter your EEG profile and should be controlled for:
Medication timing
Take your medication at your normal time on the morning of your scan. Do not take an extra dose or change your timing. The goal is to capture your brain under typical treatment conditions. If you normally take methylphenidate at 8am, take it at 8am. If you are on a long-acting formulation like Elvanse, the same applies — your usual dose at your usual time.
Sleep
Poor sleep the night before can significantly increase theta power, potentially masking medication effects. Aim for your normal sleep duration. If you had an unusually bad night, mention this at your appointment — we note it on the report so your prescriber can factor it in. For guidance on improving sleep with ADHD, see our sleep guide.
Caffeine
Caffeine is a mild stimulant that can temporarily affect EEG readings. The key is consistency: if you normally drink coffee before work, drink coffee before your scan. If you do not normally have caffeine, do not start on scan day. The goal is to replicate your typical daily conditions as closely as possible.
Exercise
Vigorous exercise within 2 hours of your scan can temporarily alter brain activity patterns. If you normally exercise in the morning, either schedule your scan for the afternoon or skip your morning workout on scan day. Light walking is fine and will not affect results.
Stress and anxiety
Acute anxiety increases beta power and can affect concentration during the Go/No-Go task. If you felt anxious during your original screening but are now more relaxed (many people are calmer the second time), this difference is noted in the report. Some apparent “improvement” in beta may reflect reduced anxiety rather than medication effect — we account for this in our interpretation.
On the day — what to expect
The follow-up appointment is straightforward, especially if you have already been through the initial screening process. Most people find the second visit more relaxed than the first because the equipment and procedure are familiar.
- Take your medication as normal. The scan should be conducted under your usual treatment conditions — this captures what your brain looks like on a typical medicated day. If you forgot your medication, let us know before we start — we may recommend rescheduling to ensure valid results
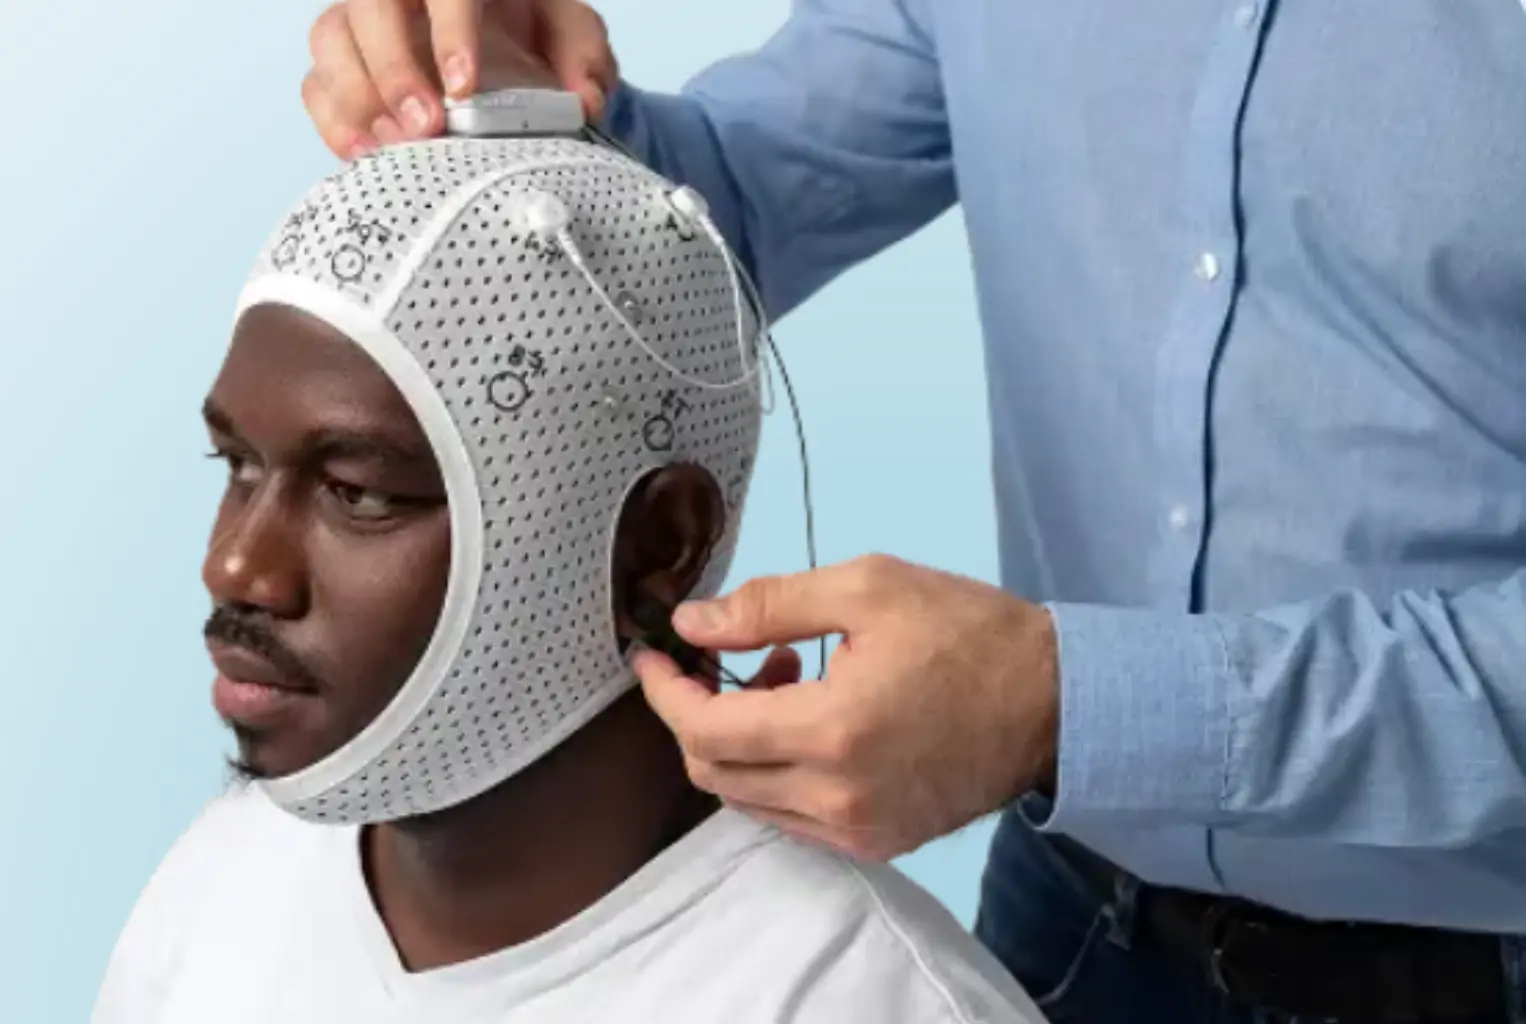
- Arrival and setup (5–10 minutes). We fit the BrainBit EEG headband, check electrode impedance and verify signal quality at Cz, Fz, F3 and F4. The headband is lightweight, non-invasive and requires no gel or skin preparation
- Eyes-open resting (2 minutes). You sit quietly with your eyes open, looking at a fixation point. This captures your baseline cortical activity under typical waking conditions while on medication
- Eyes-closed resting (2 minutes). Same position with eyes closed. Comparing eyes-open and eyes-closed conditions reveals how your brain shifts between states — a clinically relevant measure of cortical flexibility
- Go/No-Go task (3 minutes). A computerised task where you press a button for target stimuli and withhold for non-targets. This measures sustained attention (omission errors), impulse control (commission errors), processing speed and attention consistency
- Results compared on the spot. We overlay your follow-up data against your original baseline so you can see the comparison immediately. Most people find this the most compelling part — seeing their own brain data shift in response to treatment
- Full report generated. A professional PDF report is produced showing before-and-after TBR, Z-scores, band power charts and Go/No-Go comparison. This report is designed to be shared with your psychiatrist or GP at your next medication review
The entire appointment takes approximately 30–40 minutes including setup, recording, and initial results discussion. Your full comparison report is typically available within 24 hours and is sent securely via email.
Who is this for?
- Adults who had their original screening with us and have since started medication
- Children whose parents want objective evidence to support medication decisions
- Returning families — our family screening package can be used for follow-up scans across multiple family members
- Patients screened elsewhere — if you had a screening at another provider, we can still conduct a follow-up. You will not have a direct baseline comparison, but we will compare your on-medication results against published normative data for your age group
Using your report at medication reviews
One of the most valuable uses of a follow-up scan is bringing objective data to your medication review. Here is how to make the most of it:
For GP reviews
Under NICE guidelines, adults on ADHD medication should have at least annual reviews. Many GPs have limited experience with ADHD medication monitoring and rely primarily on patient self-report. Bringing a before-and-after qEEG comparison gives your GP concrete, visual evidence of treatment response. The report is designed to be interpreted without specialist training — the TBR change, Z-score trajectory and Go/No-Go comparison are clearly labelled.
For specialist reviews
If you are under the care of a psychiatrist (NHS or private, including via Right to Choose providers like Psychiatry-UK), the follow-up data can inform dose titration decisions. Specifically, if you and your specialist are weighing whether to increase a dose or switch medication, objective brain data provides an additional evidence stream alongside your clinical presentation. Several of our patients have reported that their specialist found the comparison data useful for making treatment decisions.
For shared care disagreements
Some patients experience difficulties when shared care arrangements break down — for example, a GP unwilling to continue prescribing medication initiated by a private provider. In these situations, objective brain data showing measurable treatment response can support the case for continued prescribing. While a qEEG report alone does not resolve shared care disputes, it provides documentary evidence that medication is producing measurable neurological change.
Follow-up scanning for children
Parents often have additional concerns about medicating children, and objective brain data can be particularly reassuring in this context:
- Confirming medication effect — children may not be able to reliably articulate how medication makes them feel. A follow-up scan provides evidence that is independent of the child’s self-report, which can be especially valuable for younger children or those with limited insight into their own cognitive experience
- Supporting EHCP applications — before-and-after brain data demonstrating medication response can strengthen an Education, Health and Care Plan application by providing objective neurophysiological evidence alongside clinical and educational assessments
- Informing school discussions — a report showing measurable brain changes on medication can help when discussing reasonable adjustments with schools under the Equality Act 2010
- Reassuring reluctant parents — some parents start medication with significant anxiety. Seeing a clear, positive brain response at follow-up can alleviate concerns and reinforce confidence in the treatment decision
- Monitoring during growth — as children grow and develop, their brain activity changes. Periodic follow-up scans can track whether medication continues to produce the expected neurological effect as the child matures, informing decisions about dose adjustment
Children’s follow-up sessions use the same protocol but with additional care to ensure the child is comfortable and relaxed. The BrainBit headband is non-invasive and lightweight — most children tolerate it well, especially if they have already completed an initial screening.
Long-term monitoring — how often should you scan?
There is no single correct answer, but here are the patterns we see most commonly:
- Baseline + one follow-up — the most common pattern. Original screening at assessment, follow-up at 3–6 months after starting medication. This gives you a clear before-and-after comparison for your records and your prescriber. For many people, this is sufficient
- Medication change follow-ups — an additional scan each time medication is changed (new medication, significant dose adjustment, or switching from immediate-release to modified-release). This builds a longitudinal picture of how different treatments affect your specific brain
- Annual monitoring — some patients, particularly those on long-term medication, choose to scan annually alongside their medication review. This provides ongoing objective data and can detect gradual changes over time — either improvements from sustained treatment or potential tolerance effects
- Lifestyle intervention tracking — if you have made significant lifestyle changes (regular exercise, sleep optimisation, dietary changes), a follow-up scan can show whether these changes have produced measurable effects on brain activity independently of medication
Book your follow-up scan
Same-week appointments available. Bring your medication review forward with real brain data.
Book now →The science behind medication response scanning
The principle is straightforward: if ADHD is characterised by cortical underarousal (elevated theta, reduced beta in the prefrontal cortex), and medication increases dopamine and norepinephrine in the PFC, then effective medication should shift the theta/beta ratio toward the normative range.
Research supports this:
- Meta-analyses show stimulant medication normalises aberrant brain activation in the frontostriatal and frontoparietal cortex during cognitive tasks
- A randomised controlled trial found that treating the delayed circadian rhythm in ADHD with melatonin advanced the circadian phase and reduced ADHD symptoms by 14% — demonstrating that brain-level changes translate to symptom improvement
- Studies using EEG before and after methylphenidate treatment have shown increased beta activity and improved cortical arousal in the prefrontal region, consistent with enhanced neurotransmitter availability
- Research shows high basal theta activity predicts a good response to stimulant medication — meaning your original elevated TBR may actually be a positive prognostic indicator for treatment
What a follow-up scan cannot tell you
Transparency matters. A follow-up qEEG scan is a powerful tool, but it has boundaries. Understanding these helps you interpret your results accurately and avoids placing unrealistic expectations on any single assessment:
- It cannot diagnose ADHD. A follow-up scan tracks change in brain activity over time — it does not make or confirm a diagnosis. Diagnosis remains a clinical process based on developmental history, symptom assessment and functional impairment, in line with NICE diagnostic criteria
- It cannot determine the optimal dose. A scan shows whether medication has shifted brain activity in the expected direction, but it cannot tell you whether 30mg is better than 40mg. Dose optimisation remains a clinical titration process guided by your prescriber
- TBR is one biomarker, not the complete picture. The theta/beta ratio captures frontal cortical arousal, but ADHD involves multiple brain networks. Some medication effects — improved connectivity, enhanced reward processing, better emotional regulation — may not be reflected in resting-state TBR. This is why we combine TBR with Go/No-Go behavioural data and contextualise everything against your clinical experience
- Single-session variability exists. Brain activity fluctuates naturally. A single follow-up scan captures one point in time, not a continuous average. Factors like sleep quality, stress, time of day and even seasonal variation can influence readings. We account for this in interpretation, but it is worth understanding that small changes (under 10%) may fall within normal variability
- It does not replace clinical assessment. Your prescriber’s evaluation of your symptoms, functioning, side effects and overall wellbeing remains the primary basis for treatment decisions. A follow-up scan provides additional evidence that complements clinical assessment — it does not override it
We are upfront about these limitations because we believe objective brain data is most useful when people understand exactly what it can and cannot show. Every report we produce includes a clinical context section that frames the data within these boundaries.
Frequently asked questions
A repeat qEEG screening conducted 3–6 months after starting medication, using the same protocol as your original screening. We compare your current theta/beta ratio directly against your baseline to show objectively whether medication has changed your brain activity.
Yes. Take your medication at its usual time. The follow-up measures your brain under normal treatment conditions — this gives the most accurate picture of how your brain functions on a typical medicated day.
An unchanged TBR does not necessarily mean medication is not working — clinical improvement and TBR change are correlated but not identical. However, it may suggest the current dose or medication is not optimally reaching the prefrontal cortex, prompting a discussion with your specialist about adjustment. This early identification is one of the key values of follow-up scanning.
Yes. If you did not have your original screening with us, we can still conduct a follow-up. You will not have a direct before-and-after comparison, but we compare your on-medication results against published normative data for your age group. This still provides valuable evidence for medication reviews.
Follow-up scans are priced at a reduced rate for returning patients. Contact us at info@adhdbrainscan.co.uk or +44 161 570 1638 for current pricing and to book your appointment. Same-week availability.
A follow-up scan tracks change in brain activity — it cannot diagnose ADHD, determine the optimal dose, or replace clinical assessment. TBR is one biomarker among many, and single-session variability means small changes (under 10%) may fall within normal range. We contextualise all results within these boundaries in your report.