ADHD Screening Results Explained — What Your Theta/Beta Ratio Actually Means
You’ve completed your qEEG brain screening. You have a report with numbers, ratios and clinical language. Now you want to know: what does it actually mean?
This guide explains every part of your ADHD screening results in plain English — what was measured, how it compares to published norms, what each outcome means for you, and exactly what to do next. Whether your result was normal, mildly elevated or significantly elevated, this page gives you the full picture.
In this guide
- What was measured during your screening
- The theta/beta ratio explained
- Understanding your Z-score
- The three possible outcomes
- Age-matched normative data
- Go/No-Go attention task results
- What TBR doesn’t tell you
- Clinical oversight and quality assurance
- The evidence base — what the research says
- What to do next
- Sharing your results
- Frequently asked questions
What was measured during your screening
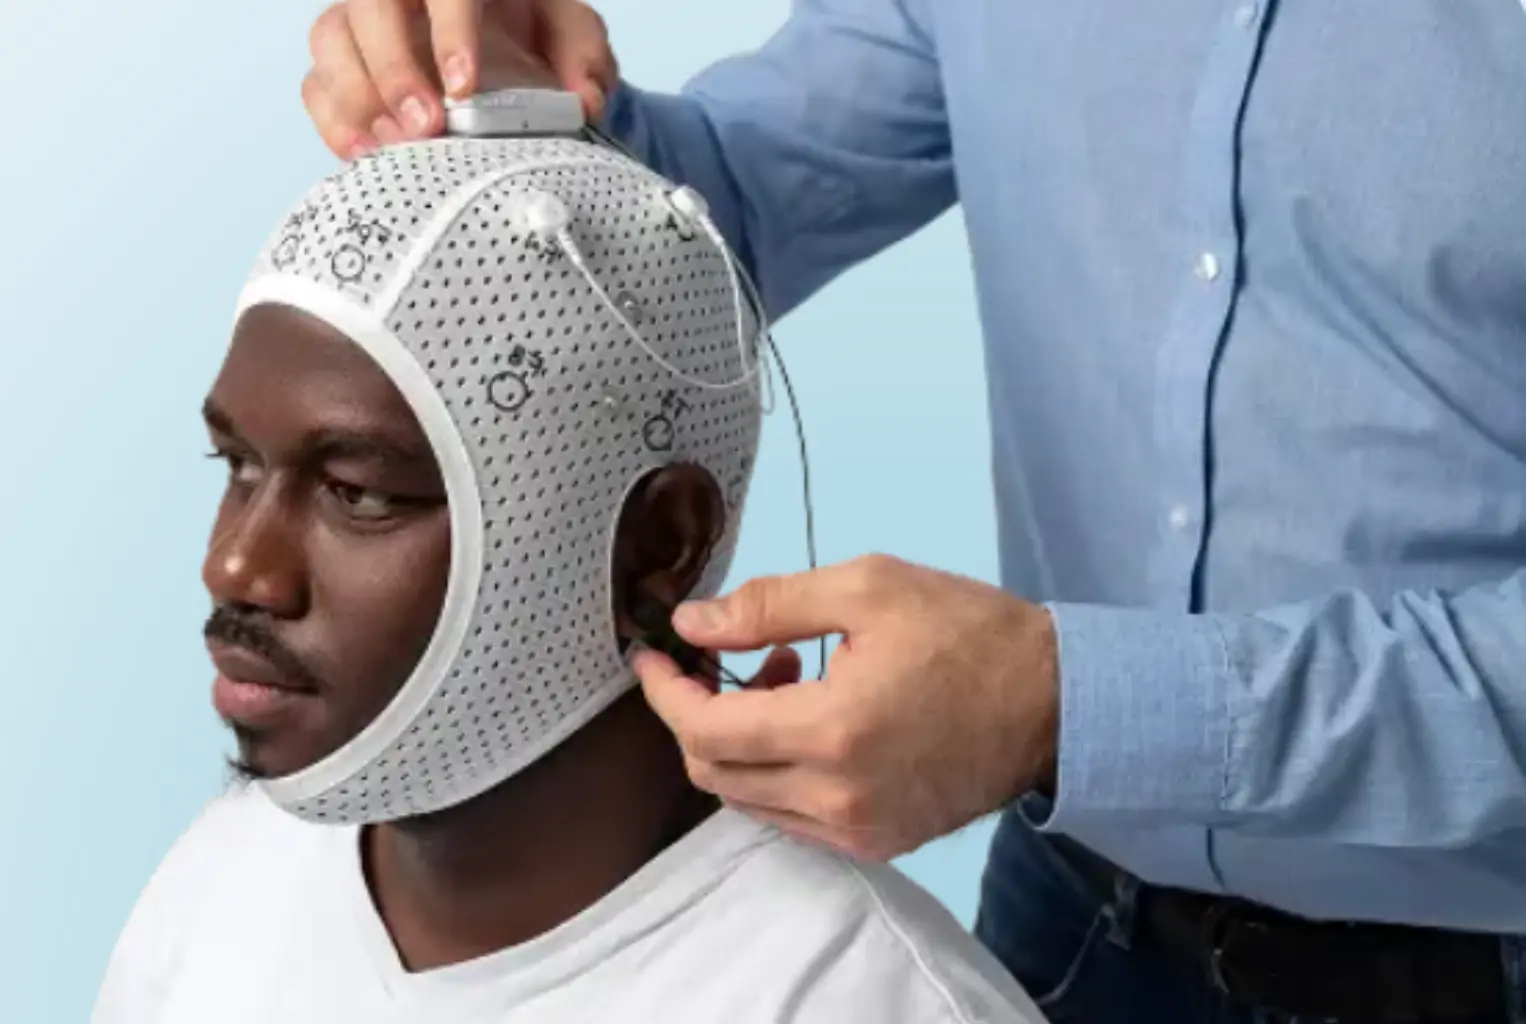
During your screening at ADHD Brain Scan UK, we placed a medical-grade EEG headband on your scalp with four electrodes positioned at standardised locations: Cz (top centre), Fz (front centre), F3 (left frontal) and F4 (right frontal). These positions follow the International 10–20 System, the worldwide standard for clinical EEG electrode placement.
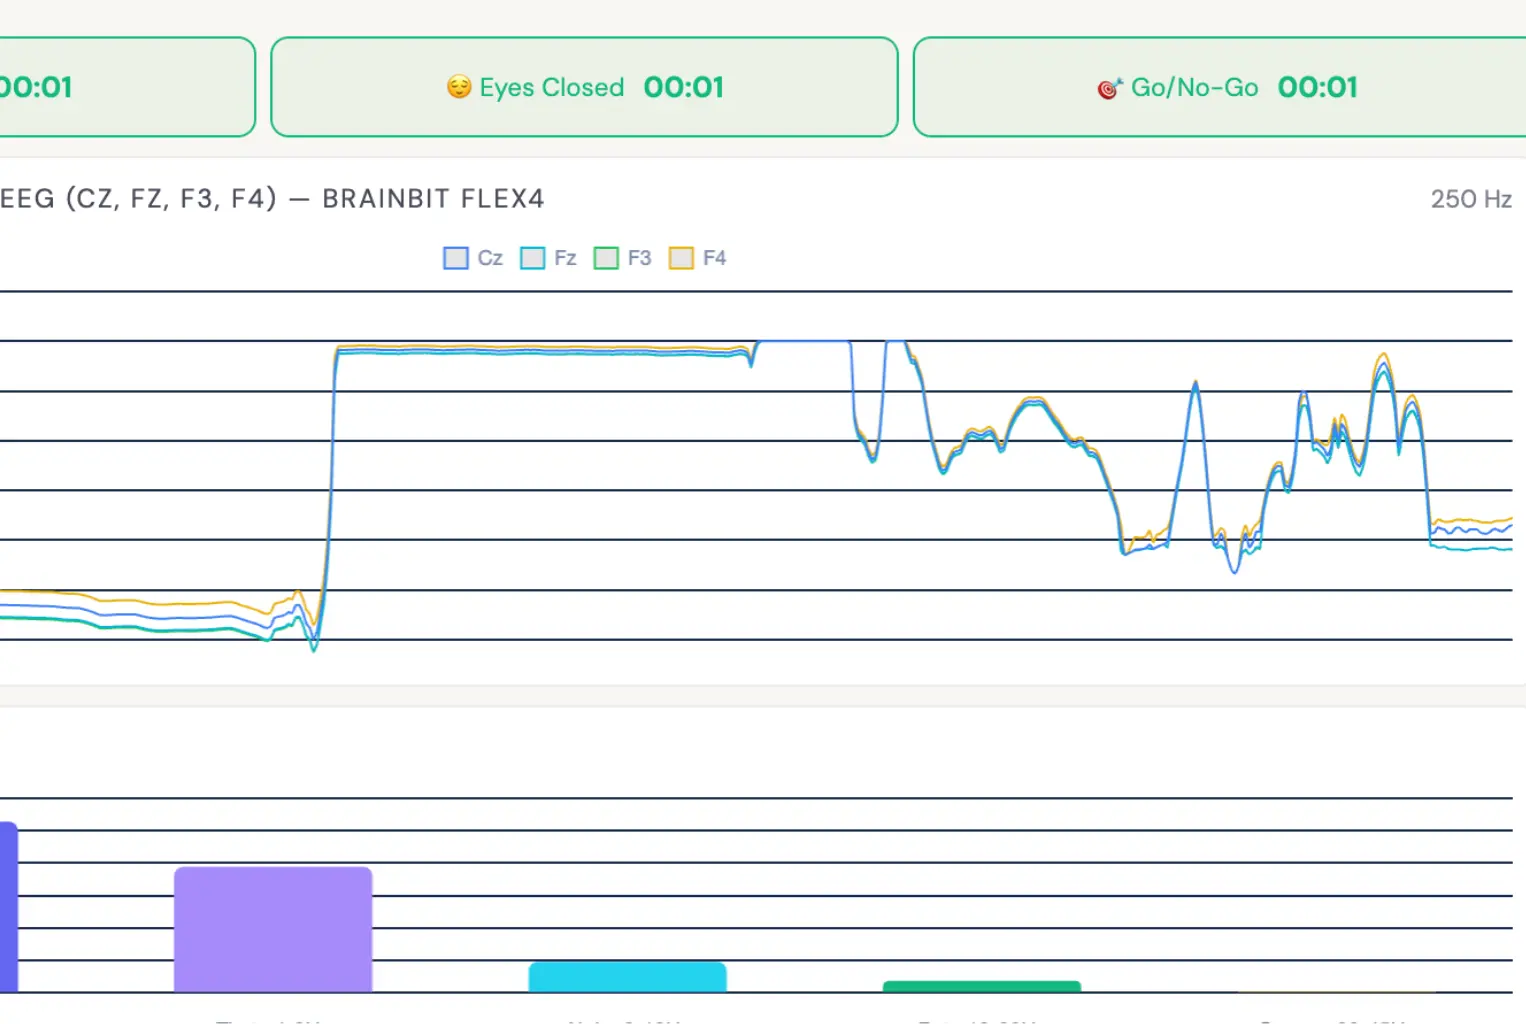
The screening followed a three-phase protocol:
- Phase 1 — Eyes open resting (2 minutes): You looked at a fixation cross on a dark screen. This measures your brain’s baseline electrical activity when you are awake, alert and visually attending.
- Phase 2 — Eyes closed resting (2 minutes): You closed your eyes and relaxed. This provides a comparison state and measures alpha rhythm prominence, which typically increases when eyes are closed.
- Phase 3 — Go/No-Go sustained attention task (3 minutes): You responded to visual stimuli by pressing spacebar for green circles (Go) and withholding for red circles (No-Go). This tests sustained attention, impulse control and reaction time consistency.
Throughout all three phases, the EEG device recorded your brain’s electrical activity at 250 samples per second across all four channels, generating approximately 60,000 data points per session. These raw signals were then decomposed into their frequency components using Fast Fourier Transform (FFT) analysis.
The theta/beta ratio explained
Your brain produces electrical waves at different frequencies. Two of the most important for ADHD screening are:
- Theta waves (4–8 Hz): Slow waves associated with daydreaming, drowsiness and internally directed thought. Your brain naturally produces more theta when it is “idling” or disengaged from external tasks.
- Beta waves (13–30 Hz): Fast waves associated with active concentration, focused attention and cognitive engagement. Beta activity increases when your brain is working on a task that requires sustained attention.
The theta/beta ratio (TBR) is simply the power of your theta waves divided by the power of your beta waves. It is calculated primarily at electrode Cz (top of the head) during the eyes-open resting condition — this is the measurement the U.S. FDA referenced when it cleared TBR as a diagnostic aid for ADHD in 2013 (NEBA System, De Novo Classification K112711).
Your report also includes TBR measurements at Fz (frontal midline) and during eyes-closed conditions. These secondary measurements provide additional context: if the pattern is consistent across multiple sites and conditions, it strengthens the finding. If TBR is elevated at Cz but not at Fz, it may suggest a more localised pattern.
Understanding your Z-score
Your report includes a Z-score, which tells you how far your TBR deviates from the average for your age group. It is calculated using age-matched normative data from published research involving hundreds of control participants.
A Z-score of 0 means your TBR is exactly at the average for your age group. A positive Z-score means your TBR is higher than average (more slow-wave activity relative to fast-wave). A negative Z-score means your TBR is lower than average.
Most clinical thresholds for concern begin at approximately +1.5 to +2.0 standard deviations above the age-matched mean. The specific threshold varies by age group because TBR naturally decreases with age as the brain matures. This is why we offer dedicated screening for children, teenagers and adults with age-appropriate normative comparisons.
The three possible outcomes
Your screening result falls into one of three categories. Each has different implications for your next steps.
✅ Within Normal Limits
Your TBR falls within the expected range for your age group. The strongest EEG biomarker for ADHD is not elevated in your case.
What this means: This does not definitively rule out ADHD. Some people with ADHD have normal TBR — this is particularly noted in women with predominantly inattentive presentation — the research shows TBR is elevated in a substantial subgroup of ADHD patients, not all of them. If you have significant symptoms, clinical assessment is still worthwhile. Your screening report can still be used as part of a broader evaluation.
⚠️ Mildly Elevated
Your TBR is above the population mean plus one standard deviation but below the clinical threshold. This is a “grey area” that warrants further investigation.
What this means: Your brain is showing somewhat more slow-wave activity than expected for your age. This is not diagnostic on its own, but combined with clinical symptoms it suggests further assessment would be valuable. Many people in this range go on to receive ADHD diagnoses after full clinical evaluation.
❌ Significantly Elevated
Your TBR exceeds the clinical threshold for your age group. This represents the strongest evidence a qEEG screening can provide.
What this means: Your brain is producing substantially more slow-wave activity relative to fast-wave activity than is typical for your age. This pattern is consistently associated with ADHD in published research. It is not a diagnosis, but it provides compelling objective evidence to support a referral for formal assessment.
Age-matched normative data
TBR naturally decreases with age as the brain matures. This is why we offer dedicated screening for children, teenagers and adults with age-appropriate normative comparisons. A TBR of 3.0 would be perfectly normal for a 7-year-old but significantly elevated for a 35-year-old. That is why your result is compared against age-matched norms, not a single universal threshold.
The normative data used in your report draws from multiple published sources including Arns et al. (2013), Monastra et al. (1999), Clarke et al. (2001) and Ogrim et al. (2012), as well as data from the Mendeley ADHD Adult Dataset where available.
| Age Group | Mean TBR | SD | Elevated (>mean+1SD) | Clinical Threshold |
|---|---|---|---|---|
| 6–7 years | 5.1 | 1.5 | >6.6 | >8.1 |
| 8–9 years | 4.2 | 1.3 | >5.5 | >6.8 |
| 10–11 years | 3.5 | 1.1 | >4.6 | >5.7 |
| 12–13 years | 3.0 | 1.0 | >4.0 | >5.0 |
| 14–15 years | 2.7 | 0.9 | >3.6 | >4.5 |
| 16–17 years | 2.5 | 0.8 | >3.3 | >4.1 |
| 18–25 years | 2.3 | 0.7 | >3.0 | >3.7 |
| 26–40 years | 2.1 | 0.6 | >2.7 | >3.3 |
| 41–60 years | 1.9 | 0.6 | >2.5 | >3.1 |
| 60+ years | 1.8 | 0.5 | >2.3 | >2.8 |
Your report shows which age group you were compared against, the specific mean and standard deviation used, and where your TBR falls relative to these norms.
Go/No-Go sustained attention task results
The third phase of your screening measured behavioural performance on a sustained attention task. This provides supplementary data alongside the EEG measurements. Your report includes several key metrics:
- Omission rate (missed Go trials): How often you failed to respond when you should have. High omission rates (above 20–30%) may suggest inattention — difficulty sustaining focus over time.
- Commission rate (false alarms): How often you responded when you should have withheld. High commission rates may suggest impulsivity — difficulty inhibiting automatic responses.
- Mean reaction time: Your average response speed. Unusually slow or fast responses can indicate processing differences.
- Reaction time variability (SD): How consistent your responses were. High variability is one of the most robust behavioural markers of ADHD — it reflects moment-to-moment fluctuations in attention.
These behavioural measures are supplementary to the TBR measurement, not a replacement. They help build a more complete picture of your attention and impulse control patterns. High omission rates combined with elevated TBR, for example, provides converging evidence from two independent sources.
What your TBR doesn’t tell you
It is important to be clear about the limitations of TBR screening. Being honest about what TBR cannot do is just as important as explaining what it can.
- TBR is not a diagnosis. It is a biomarker — a measurable biological indicator — that provides one piece of evidence within a broader clinical picture. A formal ADHD diagnosis under NICE guideline NG87 requires clinical interview, behavioural rating scales (such as DIVA, Conners or SNAP-IV), developmental history and assessment of differential diagnoses.
- TBR does not distinguish ADHD subtypes. It cannot tell you whether you have predominantly inattentive, predominantly hyperactive-impulsive or combined presentation. That determination requires clinical assessment.
- A normal TBR does not rule out ADHD. Research shows that TBR is elevated in a substantial subgroup of people with ADHD, not in every individual. Some studies suggest this subgroup may represent 60–80% of ADHD cases in children, with lower sensitivity in adults.
- TBR can be affected by other factors. Anxiety, depression, sleep deprivation, medication and caffeine can all influence brainwave patterns. Your screening practitioner will have noted any relevant factors. For women, hormonal fluctuations can also affect brainwave patterns — see our screening information for women and our hormonal connection guide.
The American Academy of Neurology’s 2016 Practice Advisory stated that TBR should not replace clinical examination but acknowledged that the combination of TBR and frontal beta power has relatively high sensitivity and specificity. A 2026 multiverse analysis using data from 1,499 participants in the Healthy Brain Network confirmed that TBR validity depends on specific methodological conditions — reinforcing the importance of standardised protocols like the one used in your screening.
Clinical oversight and quality assurance
Every screening conducted by ADHD Brain Scan UK follows a standardised protocol designed for consistency and clinical validity. The screening is conducted by Mathew Sherborne, who has completed over 200 screenings using the BrainBit EEG headband system. Each screening uses identical electrode placements (Cz, Fz, F3, F4), identical recording conditions (eyes-open resting, eyes-closed resting, Go/No-Go task), and identical analysis software.
Your results are compared against our normative database of 311+ subjects, stratified by age group, providing a population-level reference that gives your individual data meaningful context. This normative comparison is essential because raw TBR values vary naturally between individuals — what matters clinically is not the absolute number but how your ratio compares to others of your age. A TBR that might be normal for a 20-year-old could be significantly elevated for a 50-year-old, which is why precise age-matching against our published normative database is built into every single report we produce. The theta/beta ratio calculation, Z-score derivation and Go/No-Go metrics are all derived using published methodologies consistent with the broader qEEG research literature.
Your screening report is designed for clinical communication. It presents data in a format that GPs, psychiatrists and other clinicians can interpret without specialist neurophysiology training. The report includes your raw TBR values, age-matched normative comparisons, Z-scores, band power breakdowns and Go/No-Go performance metrics — everything a referral pathway needs to support the case for formal assessment.
The evidence base — what the research says
The theta/beta ratio has been studied as an ADHD biomarker for over 25 years in hundreds of peer-reviewed studies. Here is a balanced summary of the key research:
Supporting evidence
- Monastra et al. (1999, 2001): The landmark study of 482 participants aged 6–30 found TBR at Cz could identify ADHD with 86% sensitivity and 98% specificity. This was the foundation for the FDA’s NEBA clearance.
- FDA De Novo Classification K112711 (2013): The U.S. FDA cleared the NEBA System for using TBR at Cz as a diagnostic aid for ADHD in patients aged 6–17, intended as confirmatory support for clinical evaluation.
- Arns et al. meta-analysis (2013): Reviewing nine studies with 1,253 children/adolescents with ADHD, found a grand-mean effect size of 0.62–0.75 for TBR differences between ADHD and controls.
- Subgroup significance: Multiple studies confirm a “substantial subgroup” of ADHD patients deviate significantly on TBR, and TBR has prognostic value in this subgroup — particularly for predicting medication response.
Limitations and nuance
- AAN Practice Advisory (2016): Concluded TBR should not replace clinical examination and should not be used as a standalone confirmatory test outside research settings. However, acknowledged relatively high combined sensitivity and specificity.
- Arns et al. (2013) also noted: A decreasing TBR difference across study years, partly explained by increasing TBR in non-ADHD control groups — possibly due to increased screen time affecting baseline brainwave patterns in the general population.
- 2026 multiverse analysis: Using data from 1,499 participants confirmed that TBR differences depend on specific analytical choices including frequency band definition, reference scheme and region of interest. This supports the importance of standardised methodology.
What to do next
Your screening report is a powerful piece of evidence. Here is how to use it effectively:
If your result was elevated or significant
- Book a GP appointment — take your screening report and the GP letter from your support pack. Our GP appointment guide explains exactly what to say.
- Exercise Right to Choose — under NHS England policy, you can choose your assessment provider. This typically reduces wait from years to 8–12 weeks. See our full Right to Choose guide.
- Consider private assessment — if you prefer not to wait, a private psychiatrist can diagnose and prescribe. Our comprehensive assessment package includes screening plus onward referral support. Costs typically range from £600–£900. Our next steps page covers the full options.
- Start coping strategies now — you do not need a diagnosis to benefit from evidence-based ADHD coping strategies. Time management, task initiation techniques and environment design can make an immediate difference.
- Know your rights — if you work, you may be entitled to workplace adjustments and Access to Work funding. If you are a parent, our parent’s guide covers EHCP applications and school support.
If your result was normal
- Do not dismiss your symptoms. A normal TBR means the primary EEG biomarker is not elevated, but ADHD is a clinical diagnosis based on symptoms and history, not a single test.
- Still speak to your GP if you experience significant difficulties. Your screening report, even with a normal result, demonstrates that you are proactively investigating your concerns and provides useful data.
- Explore other explanations. Anxiety, depression, sleep disorders and thyroid conditions can produce ADHD-like symptoms. A clinical assessment can help differentiate these.
For everyone
Consider a follow-up medication response scan if you are diagnosed and start medication. A repeat qEEG 3–6 months later can objectively show whether your TBR has normalised on treatment — providing concrete evidence for medication reviews and long-term treatment decisions.
Read our full understanding your ADHD brain guide to learn about executive function, working memory and emotional regulation — the core difficulties that underlie ADHD symptoms regardless of your TBR result.
Sharing your results with family, partners and employers
Your screening report is yours to share as you choose. Here is how different audiences typically respond and how to frame the conversation:
With your partner or family
For many people, screening results are the first concrete evidence that something neurological — rather than behavioural — is behind their difficulties. Showing your partner or family member an objective report with numbers, comparisons and clinical interpretation can shift the conversation from “you need to try harder” to “your brain works differently.” This shift is often transformative for relationships. Frame it as: “This report shows that my brain’s frontal regions are less active than average during concentration tasks. That is why I struggle with [specific things]. It is not a lack of effort — it is a measurable neurological difference.”
With your GP
Your support pack includes a pre-written GP letter with your data embedded and formatted for clinical communication. Hand this to your GP at the start of your appointment. It presents your theta/beta ratio, Z-score and Go/No-Go results in language GPs understand, references the FDA-cleared NEBA system, and makes a clear case for specialist referral. See our GP appointment guide for word-for-word scripts.
With your employer
You are not obligated to share medical information with your employer. However, if you choose to disclose, objective brain data can support requests for reasonable adjustments under the Equality Act 2010. A screening report demonstrates a genuine neurological basis for difficulties, which is harder for employers to dismiss than self-reported symptoms. Access to Work grants can fund ADHD coaching, noise-cancelling equipment and assistive technology worth up to £16,000 per year.
With your child’s school
If your child has been screened, the report can be shared with the SENCO (Special Educational Needs Coordinator) to support requests for classroom adjustments, additional time in exams, or as evidence in an EHCP application. Objective brain data carries significant weight with schools because it is independent of teacher observation and parental report. Our parent’s guide covers how to approach these conversations.
Frequently asked questions
The theta/beta ratio compares slow-wave (theta, 4–8 Hz) to fast-wave (beta, 13–30 Hz) brain activity. In many people with ADHD, this ratio is elevated because the brain produces more slow waves and fewer fast waves during tasks requiring concentration. The FDA cleared TBR at electrode Cz as a diagnostic aid for ADHD in 2013. Read more about the science behind our screening.
No. An elevated TBR provides objective brain-based evidence supporting further investigation. A formal ADHD diagnosis requires comprehensive clinical assessment under NICE guideline NG87, including clinical interview, behavioural rating scales and developmental history. Your screening report is designed to strengthen a referral, not replace one. See our next steps guide for the full pathway.
A normal TBR does not rule out ADHD. Research shows TBR is elevated in a substantial subgroup of ADHD patients — not all. If your symptoms are significant, pursue clinical assessment regardless. Your screening report still provides useful data showing you have been proactively investigating your concerns. See our GP appointment guide.
Your Z-score shows how many standard deviations your TBR deviates from the average for your age group. Zero means exactly average. A Z-score of +2.0 means your TBR is two standard deviations above the mean — well above most people your age. Higher positive values indicate greater deviation from normal.
Yes. Research shows stimulant medication like methylphenidate can normalise TBR in responsive patients by increasing beta activity. A follow-up medication response scan 3–6 months after starting medication can objectively show whether your brain activity has changed — valuable evidence for medication reviews.
As of early 2026, NHS Digital estimates over 735,000 open referrals are waiting for ADHD assessment in England, with approximately 62% of adults waiting over a year. Right to Choose through approved providers like Psychiatry-UK typically reduces the wait to 8–12 weeks. Private assessment is typically available within 2–4 weeks at a cost of £600–£900.
Yes. Your qEEG screening report can be included as supporting evidence in EHCP applications. It provides objective brain data that complements teacher observations, behavioural assessments and clinical reports. See our parent’s guide for the full EHCP process.